|
|
|
|
|
|
|
|
|
|
|
|
|
 |
Volcanic Events, pg. 2 Mount St. Helens History, pg. 3-15 Eyewitnesses, pg. 53-67 Absolute Times, pg. 81-82, 86 Activity Sequence, pg. 127-134 Gas Studies, pg. 190-191 |
Chemical
Compositions, pg.
233-250
Ash Clouds, pg. 323-333 Blast Dynamics, pg. 379-400 Rapid Deposition, pg. 466-478 Phreatic Explosions, pg. 509-511 New Lava Dome, pg. 540-544 Ash-Fall Deposits, pg. 568-584 Water Chemistries, pg. 659-664 River Water Quality, pg. 719-731 |
AIR-FALL DEPOSITS
Ash falls accompanied every major eruption in 1980, as well as the steam-blast eruptions prior to May 18. The resulting air-fall ash stratigraphy is complex but is resolvable because observations were made after each major eruption. The data collected permit correlations and comparisons between the individual air-fall deposits and variations in eruptive behavior, changing composition and volume of erupted magma, direction and velocity of upper winds, effects of eolian fractionation, and with earlier ash deposits from Mount St. Helens and other similar volcanoes.
During the early steam-blast activity from March 27 to May 14, the volume of ash erupted and the area covered were small, and the total bulk volume was only about 8 x 10⁵ m3 (Sarna-Wojcicki, Waitt, and others). The ash consisted entirely of angular lithic and crystal grains that originated by abrasion and brecciation of preexisting rocks from the conduit and vent. The volume of ash erupted is less, by an order of magnitude, than the volume of the crater formed during the same time interval, mainly because the volume of the new crater resulted partly from deformation and partly from melting of ice in the preexisting summit crater.
Air-fall deposits of the May 18 eruption display a complex stratigraphy reflecting the multiple eruptive events. Deposits within a few tens of kilometers of the volcano contain four principal units (Waitt and Dzurisin): (1) basal gray lithic ash that contains much organic material and is related to the directed blast, (2) tan pumice and lithic lapilli deposited from the plume of the vertical eruptive column, (3) pale-brown vitric ash interpreted as related to ash clouds generated by pyroclastic flows on the north slope and to large steam explosions near Spirit Lake, and (4) fine gray ash that resulted from the waning of the the eruption late on May 18 and settling out of fines still in the atmosphere from earlier activity. Such a sequence, deposited within 12 hr on May 18, demonstrates that multiple stratigraphic units can be deposited rapidly during a single eruptive sequence.
More distant ash-fall deposits show fewer units, as coarser and denser lithic and crystal fragments preferentially settled out, resulting in deposition of a single bed of fine vitric ash at distances of more than a few hundred kilometers from the vent (Sarna-Wojcicki, Shipley, and others). Ash fall was visible at least 1,500 km to the east. Mapped distributions of the ash-fall deposits differ from radar and satellite locations of the airborne ash cloud, reflecting different wind directions and velocities at different altitudes and times. Thickness and volume of the combined tephra of May 18 are similar to those of the major 19th-century air-fall deposit (tephra layer T), but are an order of magnitude less than the largest prehistoric tephra units from Mount St. Helens.
Air-fall deposits of the explosive eruptions from May 25 through Oct.
16-18 are much smaller than those of May 18, and they generally decreased
in volume with time (Waitt and others). These deposits trend in varying
azimuths away from the volcano, reflecting differing wind directions. Each
shows offsets in thickness and grain-size axes, which resulted from differing
directions and velocities of high- and low-level winds, and each shows
a local increase of thickness far downwind from the volcano.
THE 1980 ERUPTIONS OF MOUNT ST. HELENS, WASHINGTON
PREMAGMATIC ASH ERUPTED FROM MARCH 27
THROUGH MAY 14, 1980-EXTENT, MASS,
VOLUME, AND COMPOSITION
By ANDREI M. SARNA-WOJCICKI, RICHARD B. WAITT,
JR.,
MARTA J. WOODWARD, SUSAN SHIPLEY, and JOSE RIVERA
ABSTRACT
During the early period of activity from March 27 until May 14, the volume of ash erupted and the area blanketed by the ash were small. Much of this early ash alternated with snow accumulations, and as a result, a detailed stratigraphy of ash and snow was briefly preserved. We estimate the total mass of early ash erupted to be about 1012 g, and to have a total bulk volume of about 8 x 10⁵ m3 (assuming a bulk density between 1.2 and 1.6 g/cm3). Assuming the ash to have come from rock having a density of 2.6 g/cm3, this corresponds to a volume of 4 X 10⁵ m3 of solid rock, an order of magnitude less than the 7.5 X 10⁶ m3 volume of the crater in mid-April. The discrepancy in volume is due to (1) the amount of ash erupted being underestimated on the flanks and summit area of the volcano and in far-distal areas, (2) the volume of the summit crater that had been glacial ice, and (3) the volume of the crater caused by crustal distention.
Ash erupted during the early period consisted of angular lithic and crystal grains nearly identical in mineralogy and chemical composition to coarse lithic ejecta at the summit of the volcano. These ejecta probably originated by abrasion and brecciation of preexisting rocks within the vent during gas explosions. Juvenile material was not found in this early ash.
Lithic-crystal ash of this
type may be mistaken for clastic detritus in sedimentary strata. As at
Mount St. Helens and other similar volcanoes when such ash can be identified,
it may serve as a precursor to future major magmatic eruptive episodes.
INTRODUCTION
From March 27 through May 14, small non-magmatic eruptions ejected ash
as high as 2.5 km above the summit crater. Ash was carried by wind in every
direction within a radius of about 50 km; dustings were reported from as
far as Bend, Oreg., 250 km to the south, and 120 km to the north at Tacoma,
Wash.
ASH AND SNOW STRATIGRAPHY OF
EARLY NONMAGMATIC ERUPTIONS
Beginning March 27, Mount St. Helens was monitored and photographed such that not only were many times and durations of venting events recorded, but the azimuths of many airborne plumes and air-fall lobes were routinely recorded.
Much of the ash erupted during the nonmagmatic phase was deposited on snow, particularly at higher elevations near the volcano, during late March and early April. During these eruptions ash falls were often interspersed with snowfalls, and on occasion snow and ash fell together. This stratigraphy made it possible to identify ash layers from individual small eruptions and to sample ash uncontaminated by ground detritus (fig. 323). Uncontaminated samples could also be collected from natural sediment traps such as leaves.
In late April and early May much of the snow cover had melted and ash was deposited directly on the ground, as it had been at lower elevations farther from the volcano throughout the early activity. As the top layer of snow melted, the younger layers of ash became superposed on earlier ones below, until the entire sequence was telescoped into a single layer. Ash layers exposed at the surface and underlain by snow rapidly developed a small-curd texture apparently caused by wetting of the ash with melting of underlying snow, and accretion of the wet ash owing to surface tension (fig. 324). In most places, where the ash cover was uneven or patchy, the ash melted the underlying snow faster than the adjoining ash-free snow melted, because ash has a lower albedo than snow and absorbs more heat from insolation during the day (see Driedger, this volume). The wet ash layer became progressively uneven if not discontinuous, and formed a diffuse base owing to the downward transposition of fine ash particles into the melting snow. In melted areas, the remnant composite ash layer was patchy even where ash fall had been relatively heavy. Where ash fall had been light, the ash so blended into the groundcover that it was not a recognizable, discrete layer. The ejecta from relatively energetic eruptions were much coarser and thicker in the summit area than on the lower flanks of the volcano; the smaller eruptions deposited virtually all their ejecta on the upper flanks. Some of the denser eruptive clouds produced slope-hugging cold flows of ash clouds down the downwind flank of the volcano. The flows would separate from the surface about halfway down the mountain, leaving a very sharp margin of the deposit (fig. 325).
From March 27 until April 1 the bases of ash columns from the volcano
were dark gray and even black at the base, as was the color of newly fallen
ash on snow, indicating that the ash was erupted and fell wet. After April
1 some of the ash plumes were gray to light gray, also the color of ash-fall
lobes on the mountain. These colors indicate that some ash was erupted
and fell relatively dry. On April 4, for example, 9 km northwest of the
crater a sample was collected dry as the ash fell through clouds on a generally
rainy day--indicating that the ash was erupted dry and warm enough to remain
dry in transit despite the wet clouds.
MASS AND VOLUME OF
EARLY NONMAGMATIC ASH
Estimates of minimum mass and volume of material erupted prior to April 16 were made from samples collected during April 14 through 16. Direct measurements of ash thickness were unreliable because of the diffuse and uneven snow-ash boundaries.
Samples for mass measurements were collected from about 30 sites within
a 40-km radius of the volcano, although the upper flanks of the volcano
where the deposit was decimeters or meters thick was not measured. We collected
the samples from 30 X 30-cm or larger areas where snow was still on the
ground, which isolated the ash from ground detritus. The collected ash
was separated from thawed snow water by suction filtering, then dried and
weighed. An isomass (mass per unit area) map obtained by contouring the
resultant values shows a multi-lobe pattern of deposition that reflects
winds during the different eruptions (fig. 326). To estimate the mass of
material erupted, areas within each isomass contour were measured by planimetry,
and the areas multiplied by their respective mass increments. The total
estimated mass is about 8 x 10¹¹ g. This estimate does not include
the mass of ash produced during minor nonmagmatic eruptions that followed
our volumetric sampling. If included, deposits of eruptions between April
17 and 22 and between May 7 and 14 would increase our estimate by no more
than one third, to a total of 11 x 1011 g. Even with this adjustment,
the mass estimate is minimal. Neither the thick ejecta on the high flanks
and summit of the volcano nor distal areas sprinkled by ash are accurately
represented. Assuming a bulk density between 1.2 and 1.6 g/cm3 for
the uncompacted ash, the total ash blanket from the early nonmagmatic eruptions
would amount to a volume of 7-9 X 10⁵ m3. Assuming
a rock density of about 2.6 g/cm3 for the summit-crater rock
prior to eruption (somewhat lower than the 2.8 g/cm3 typical
of solid dacite to allow for fracture porosity, voids, and ice in the summit
rocks), the estimated mass would be equivalent to 4 X 10⁵ m3
of solid rock, more than an order of magnitude less than the estimated
7.5 X 10⁶ m3 of material missing from the crater
that had formed before May 18 (Moore and Albee, this volume). This discrepancy
can be attributed to (1) the volume of the summit crater that had been
glacial ice rather than rock, (2) our estimate of nonmagmatic-eruption
mass underrepresenting the coarse ejecta thickly deposited near the summit
of the volcano and the fines deposited downwind, and (3) the volume of
the crater that was caused by structural collapse rather than by explosive
excavation.
COMPOSITION OF PREMAGMATIC
ASH AND COARSE EJECTA
The tephra produced during the premagmatic phase of eruption originated by abrasion of rock within the crater and vent. The ash consists of moderately sorted to very poorly sorted euhedral to anhedral crystals, crystal fragments, and lithic grains, but contains no juvenile material such as volcanic glass or pumice. Some lithic fragments, however, have a vitric ground-mass. Scanning-electron-microscope photographs of the ash show rounded edges, conchoidal fractures, and impact pits, probably caused by abrasion in the vent (figs. 327, 328). Dominant phyric minerals are calcic plagioclase and hypersthene, with subordinate amounts of clinopyroxene and hornblende and minor iron-titanium oxides. No phyric quartz was observed in the samples, although a pure-silica phase was detected under the electron microscope by energy-dispersive X-ray fluorescence spectrometry. The silica is in the form of cocoon-like coatings on some grains (fig. 329), probably opal or crystobalite formed by hydrothermal activity in the vent. Petrography of thin sections of lithic ejecta from the nonmagmatic events collected at the former summit crater indicates that the mineralogy of proximal lithic fragments is nearly identical to that of the more distal ash. Energy-dispersive X-ray fluorescence spectra of some minor and trace elements of lithic ejecta and coarse ash collected at the former summit (table 65) indicate that summit ash and lithic ejecta are nearly identical in chemical composition, further indicating that the ash originated as rock that was pulverized within the volcanic vent.
There is a systematic change in composition of ash that accumulated
progressively farther downwind (fig. 330; table 65), probably because fine
lithic fragments and the finer grained matrix were winnowed from the coarser
lithic and crystal fraction. From the former summit crater downwind to
20 km, the ash was enriched with the heavier and coarser crystals of feldspar
and ferromagnesian minerals together with coarser lithic fragments, while
fine lithic fragments and fine-grained matrix minerals probably were winnowed
out and carried downwind beyond the sampled zone. The higher proportion
of crystals is reflected in the enrichment of strontium relative to rubidium
in the proximal downwind samples. The strontium, like calcium, is concentrated
in the more coarsely crystalline, early crystallizing phyric minerals,
whereas the rubidium most likely resides in the fine-grained, late crystallizing
fraction that makes up the matrix of the rock. Ejecta near the vent are
coarse and dominantly lithic. Downwind near the volcano, the coarser lithic
and phyric fragments tend to settle out, while finer grains remain suspended.
At distal sites, the proportion of fine-grained matrix crystals and fine-grained
lithic fragments tends to increase relative to other components.
NONMAGMATIC LITHIC-CRYSTAL ASH IN
THE STRATIGRAPHIC RECORD AS
PRECURSOR TO MAGMATIC ERUPTION
The type of premagmatic ash erupted from Mount St. Helens between March
27 and May 14 could easily be overlooked within clastic sedimentary strata--
especially in volcanic terrane where such ash is petrographically similar
to clastic detritus. Identified by texture, mineralogy, and chemistry,
such tephra layers may constitute marker beds for stratigraphic correlation.
Eruptions of lithic-crystal tephra at Mount St. Helens presaged the magmatic
eruption of May 18. We are currently studying similar lithic-crystal tephra
layers in the stratigraphic section at Mount St. Helens to determine their
temporal relations to older pumiceous tephra units and thereby to determine
their usefulness as precursors to older major magmatic eruptions.
THE 1980 ERUPTIONS OF MOUNT ST. HELENS, WASHINGTON
AREAL DISTRIBUTION, THICKNESS, MASS,
VOLUME, AND GRAIN SIZE OF AIR-FALL ASH
FROM THE SIX MAJOR ERUPTIONS OF 1980
By ANDREI M. SARNA-WOJCICKI, SUSAN SHIPLEY,
RICHARD B. WAITT, JR., DANIEL DZURISIN,
and SPENCER H. WOOD1
1Boise State University, Boise, Idaho 83725
ABSTRACT
The airborne-ash plume front from the Mount St. Helens eruption of May 18 advanced rapidly to the northeast at an average velocity of about 250 km/hr during the first 13 min after eruption. It then traveled to the east-northeast within a high-velocity wind layer at altitudes of 10-13 km at an average velocity of about 100 km/hr over the first 1,000 km. Beyond about 60 km, the thickest ash fall was east of the volcano in Washington, northern Idaho, and western Montana. A distal thickness maximum near Ritzville, Wash., is due to a combination of factors: (1) crude sorting within the vertical eruptive column, (2) eruption of finer ash above the high-velocity wind layer at altitudes of 10-13 km, and (3) settling of ash through and below that layer. Isopach maps for the May 25, June 12, August 7, and October 16-18 eruptions show distal thickness maximums similar to that of May 18.
A four-unit tephra stratigraphy formed by the May 18 air fall within proximal areas east of the volcano changes to three units, two units, and one unit at progressively greater distances downwind. Much of the deposit beyond 200 km from the volcano has two units. A lower thin dark lithic ash is inferred to represent products that disintegrated from the volcano's summit in the initial part of the eruption and early juvenile pumice and glass. An upper, thicker, light-gray ash rich in pumice and volcanic-glass shards represents the later voluminous eruption of juvenile magma. The axis of the dark-ash lobe in eastern Washington and northern Idaho is south of the axis of the light-gray ash lobe because the high-velocity wind layer shifted northward during the eruption. The areal distribution of ash on the ground is offset to the north relative to the mapped position of the airborne-ash plume, because the winds below the high-velocity wind layer were more northward.
Except for the distal thickness
near Ritzville, Wash., mass per area, thickness, and bulk density of the
May 18 ash decrease downwind, because larger grains and heavier lithic
and crystal grains settled out closer to the volcano than did the lighter
pumice and glass shards. A minimum volume of 1.1 km3 of uncompacted
tephra is estimated for the May 18 eruption; this volume is equivalent
to about 0.20-0.25 km3 of solid rock, assuming an average density
of between 2.0 and 2.6 g/cm3 for magma and summit rocks. The
estimated total mass from the May 18 eruption is 4.9 X 10¹⁴
g, and the average uncompacted bulk density for downwind ash is 0.45 g/cm3.
Masses and volumes for the May 25 and June 12 eruptions are an order of
magnitude smaller than those of May 18, but average bulk densities are
higher (about 1.00 and 1.25), owing to compaction by rain that fell during
or shortly after the two eruptions. Volume and mass of the July 22 eruption
are two orders of magnitude smaller than those of May 18, and those of
the August 7 and October 16-18 eruptions are three orders of magnitude
smaller. The eruption of May 18, however, is smaller than five of the last
major eruptions of Mount St. Helens in terms of volume of air-fall tephra
produced, but probably is intermediate if the directed-blast deposit is
included with the air-fall tephra.
INTRODUCTION
The eruption of Mount St. Helens on May 18, 1980, and the succeeding major eruptions present an excellent opportunity to study dispersal patterns and depositional characteristics of windborne ash. Many large historic volcanic eruptions have occurred on islands or peninsulas adjacent to oceanic areas or in areas of difficult access. Where volcanoes have been accessible to direct observation, most downwind ash plumes have been carried across ocean areas, and the areal extent, thickness, grain size, and mass of ash could not be fully documented. Specific eruptions in point are Tamboro (1815), Krakatoa (1883), Katmai (1912), Hekla (1974), and Bezymianny (1956). Quizapu volcano (1932), however, is a notable exception. The May 18 eruption of Mount St. Helens occurred on land, and the ash plume was carried eastward across accessible areas where observations could be readily made on the ground. In addition, owing to technological developments within recent years, satellite imagery was available to track the areal extent and progress of an airborne-ash plume.
We mapped the areal distribution of an airborne-ash plume, charted its
downwind progress, and compared its airborne distribution with the distribution
of the ash lobe on the ground. Several geologists sampled across the ash
lobe shortly after the ash had fallen; therefore, various characteristics
were documented before the ash was disrupted by wind or rain. Because each
geologist conducted a traverse completely across the fallen-ash lobe, using
the same methods and observational criteria, a coherent, compatible data
base was provided.
ACKNOWLEDGMENTS
This report is the result of a large cooperative effort by many individuals who contributed observations, samples, and other help and information. We are particularly grateful to T. E. Bateridge, J. O. Davis, W. H. Hays, M. P. Doukas, James Beget, Evelyn Newman, Robert Mark, Carol Price, Daniel May, Albert Eggars, Carolyn Driedger, Harry Glicken, Michael Ryan, M. W. Brugman, David Sawyer, and C. C. Helicker for conducting sampling traverses across tephra lobes.
We are also grateful to R. P. Hoblitt, P. L. Weis, Barry Voight, Thor
Kiilsgaard, C. F. Kienle, Jr., Sandra Embrey, Edwin Olson, Gregory Hahn,
J. A. Barker, Brian Atwater, Kenneth Fox, F. K. Miller, J. W. Nichols,
Mrs. David Mahre, W. P. Nash, Bruce Cochran, C. R. Knowles, Lynn Disbrow,
Lester Zeiheu, Glen Izett, Carl Rice, Edwin Danielson,
Robert Courson, Robert Quinn, Michael Folsom, Daisuke Shimozuru, E. F. Hubbard, Steve Frenzel, Marv Fretwell, David Frank, D. P. Dethier, Norman Banks, R. R. Hooper, T. A. Cahill, R. E. Wilcox, James Bailey, John Strong, and D. B. Mitchell for providing samples, observational data, or other information.
We are grateful to Gail McCoy, who helped to compile thickness data
and helped with grain-size analyses, and to Craig McHendrie, who helped
with computer processing of grain-size data.
VERTICAL GROWTH AND DOWNWIND PROGRESS
OF THE ASH PLUME FROM THE MAY 18 ERUPTION
A few minutes after the start of the eruption at 0832 PDT (Pacific Daylight time) on May 18, a vertical column of hot, ash-charged gas shot vertically from the volcano and grew rapidly to altitudes of 23 km or more. According to an airborne eyewitness, the vertical plume rose to an altitude of 7.6 km at 0838, to 10.7 km at 0840, and to about 18 km at 0842 (Rosenbaum and Waitt, this volume). The column expanded rapidly into a mushroom shape 10 min after the start of the eruption. By 0845, the time of the first satellite images after the start of the eruption, the ash plume had expanded to an ovoid lens about 80 km long in an east-west direction, 45 km wide in the north-south direction, and about 9-14 km in thickness (figs. 331, 332). At 0845 the top of the ash plume had risen to 23 km, and by 0900, to perhaps as much as 27 km (Carl Rice, oral commun., 1980). The average vertical rate of ascent of the column between 0838 and 0842 is 44 m/s, or about 160 km/hr (fig. 333). By 1012 the column had subsided to an altitude of about 13 km, but the eruption continued into the late afternoon.
The prevailing westerly wind swept the ash plume east-northeast. From a sequence of NOAA satellite photographs taken from stationary orbit at half-hour intervals between 0845 and 1816 on May 18 (fig. 332), we compiled an isochron map of the airborne-ash plume front. By 0945 the widening plume front passed over Yakima, Wash., 135 km downwind, and by about 1200, over Spokane, Wash., and Moscow, Idaho, about 400 km east of Mount St. Helens. By about 1500 the plume front had passed over Mis-soula, Mont., where changing wind directions swung the front to the southeast. By about 1800, the plume front had passed into northwestern Wyoming. After nightfall on May 18, the plume could not be monitored with visible-spectrum photographs, and infrared imagery was insufficient to define plume boundaries. By the morning of May 19, the ash plume had passed into the midcontinent, where its margins became so diffuse and mixed with clouds that its boundaries could not be accurately detected. The densest part of the ash plume, however, was tracked across the plains to the East-Central United States, where it swung northeast over New England, Maritime Provinces of Canada, and out over the North Atlantic Ocean. Traveling eastward, the ash plume returned over the West Coast of North America in early June after circling the globe (Danielson, 1980). Although high-velocity winds at altitudes of 10-13 km carried the main body of ash eastward, higher stratospheric winds carrying some fine ash looped over the Northwestern United States, then veered westward and carried the finest ash over the North Pacific Ocean (Danielson, 1980).
The heaviest ash fall from the plume east of Mount St. Helens was observed in Washington, northern Idaho, and western Montana; lighter ash fall was reported in Wyoming, western South Dakota, western Nebraska, Colorado, and northern New Mexico. Light dustings were sporadically reported farther east and northeast. The finest ash, which remains suspended in the atmosphere, has circled the Earth many times; on the basis of the effects from historic eruptions such as Krakatoa in 1883 (G. J. Symons, 1888), it is likely to remain suspended in the atmosphere for years.
We derived a traveltime curve (fig. 334) for the front part of the plume from figure 332 by plotting the time the plume traveled since the start of the eruption against the maximum horizontal distance it traveled between each satellite photograph. Plume-front velocities calculated from satellite imagery give estimates of the horizontal component of velocity only. An average horizontal component of velocity of the tephra plume front for the first 13 min is about 250 km/hr. The average azimuth of maximum velocity 13 min from the start of the eruption is about 040° from the volcano. This azimuth is intermediate between the predominantly northward direction of the initial directed blast and the 058° azimuth of the axis of the air-fall lobe that was determined from subsequent thickness measurements on the ground. This relation suggests that the initial directed-blast cloud was rapidly swept toward a more easterly direction by the prevailing wind. Because the 250-km/hr velocity represents an average over the first 13 min, and because the plume-front velocity decreased after the first 13 min, velocities of the expanding ash cloud in the first few minutes of the eruption must have been much greater. Average velocities of the ash-plume front over the first 13 min, as calculated from satellite photographs, were only about 220 km/hr in the direction of the prevailing wind, about 185 km/hr northward, about 150 km/hr northwestward, and zero to the south and southwest. The velocity of the plume front averaged about 100 km/hr as it traveled east-northeast over the first 1,000 km. Fine ash erupted above the level of high-velocity winds (above 13 km altitude) was carried at lower velocities along different trajectories (Danielson, 1980).
We do not have accurate altitude control for the ash-plume front as
it traveled east-northeast. The base of the leading edge of the plume was
reported to be at about 11.9-12.2 km, which corresponds to the high-velocity
air layer along much of its observed route in the Western States, but diffuse
parts of the downwind plume were observed to altitudes of about 21.3 km
(Edwin Danielson, NASA-Ames, oral com-mun., 1980). Typical wind profiles
at Spokane, Wash., for the period 1600 on May 17 to 0400 on May 19 (fig.
335), show velocity maximums at altitudes of 10.7-12.2 km. Low-level winds
were more northward than were the high-level winds (fig. 335), which offset
the ash lobe on the ground to the north relative to the position of the
airborne cloud.
AREAL EXTENT AND THICKNESS OF
ASH FROM THE MAY 18 ERUPTION
During traverses across the ash lobe, uncompacted thickness of ash was measured, and samples were collected from measured areas to determine the mass per area. Samples were collected from surfaces that were generally free of ground litter or dust prior to the eruption--from vehicles, shed roofs, and other artificial surfaces away from heavily traveled roads. The initial uncompacted thicknesses were measured before the first rain on May 21. Because most of the traverse through Ritzville, Wash., was made on May 21 and 22 after rain had begun, thickness values there were lower than those made before rain had started. We have adjusted the thickness values along this traverse by using associated mass-per-area values, and by comparing these values to mass-per-area values and associated uncompacted thicknesses along adjacent traverses that were measured before rain had started. Adjusted initial thicknesses for the Ritzville, Wash., traverse are on the average twice those measured after the rainfall.
The "saddle" near Vantage, Wash., and the distal thickness maximum near Ritzville, Wash. (figs. 336, 337), are unusual. This type of distribution has been documented only once--for the 1932 eruption of Quizapu (Larsson, 1937). Isopach maps for eruptions of May 25, June 12, August 7, and October 16-18 show similar distal thickness; thus, such features may be fairly common. Because these distal thickness highs were formed on fair days as well as rainy, they cannot be attributed to scavenging of ash by rain, a mechanism suggested for anomalous distributions of downwind thickness by Wilcox (1959).
We do not understand how the distal thickness maximum near Ritzville, Wash., formed. Major factors controlling downwind distribution of tephra in an eruption such as that of May 18 are the height of the vertical eruptive column, the size range and distribution of ejecta, the velocities and directions of wind at different altitudes above the volcano and downwind, and the manner in which these factors vary with time. The vertical eruption column, which extended above the high-velocity wind layer for much of the day, probably acted as a crude sorting mechanism. J. G. Moore (written commum., 1980) suggested that the distal thickness maximum near Ritzville, Wash., formed from fallout of ash that was erupted above the high-velocity wind layer; the thickness low near Yakima, Wash., formed from ash injected into the high-velocity layer; and the primary areas of maximum thickness near the volcano formed from ejecta erupted below the high-velocity layer.
Along the easternmost traverse through Missoula, Mont., ash was too thin in most places to measure directly. Thicknesses for this traverse were estimated by comparing an average of three uncompacted thicknesses in Missoula, where the ash was thick enough to measure, with the average of associated masses per area. Thicknesses at other sampled sites in this traverse were calculated by applying this ratio to the known mass per area at each site.
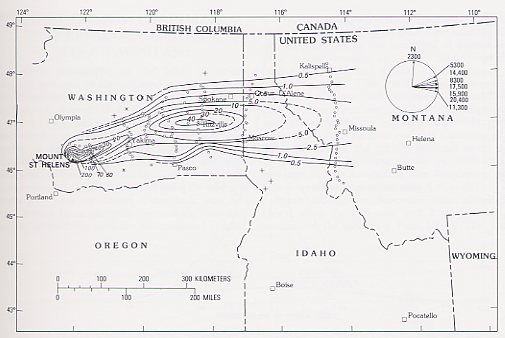
Figure 336.--Isopach map of air-fall ejecta on May 18. Lines represent uncompacted thickness, in millimeters. +, light dusting of ash; x, no ash observed; circles, observation sites. Circular diagram shows average directions toward which wind was blowing, for different altitudes, at 1020 PDT on May 18, at Spokane, Wash. Data from U.S. National Meteorological Service. Thicknesses along north-south traverse through Ritzville and at four observation sites about 30-50 km to the west have been adjusted for postdepositional compaction due to rain. Ash along north-south traverse through Missoula was too thin to measure directly, and thicknesses have been calculated from mass per area, using thickness and associated mass per unit area measured near Missoula. Data on north-south traverse through Ritzville and four sites 30-50 km to the west from J. O. Davis. Data on north-south traverse through Missoula from Thomas Bateridge. Data in vicinity of Spokane from Paul Weis.
Sampling traverses were not made east of western Montana, though spot
thicknesses were reported farther east and southeast in Montana and Wyoming.
Only a light "dusting" of ash fell farther downwind than Wyoming. Some
reports of thicknesses within our map area by other observers were much
higher than those stated in this report; for example, maximum thicknesses
more than two times those reported in this study were observed by USGS
personnel about 54 km north of Moscow, Idaho, near the axis of the May
18 ash plume (fig. 336) (Ernest F. Hubbard, oral commun., 1980). Hooper
and others (1980) reported ash 1.25 cm thick in Moscow, Idaho, whereas
we measured 0.4 cm on May 20 and 21. There are several possible reasons
for these discrepancies: First, where observations were made prior to ours,
initial uncompacted thicknesses may have been greater owing to greater
initial cohesion between ash particles. Second, some observers may have
reported maximum rather than average thicknesses. Thicknesses shown in
figure 336 are the same as or lower than those reported by others. Our
measurements are internally consistent and agree with isomass data that
are based on independent measurements. Because some compaction undoubtedly
occurred before some ash was measured, our estimate of initial bulk volume
is a minimum. Initial uncompacted thickness is an ephemeral parameter that
is not easily measured; consequently, it is not as reliable as isomass
or compacted thickness.
MASS AND BULK DENSITY OF FALLEN
ASH FROM THE MAY 18 ERUPTION
Compaction due to loading, wind, rain, or time will not affect measurements of mass, because mass per area is unchanged by compaction. Samples collected from measured areas were weighed, and mass per unit area was contoured (fig. 338). The shape of the isomass map is generally the same as that of the isopach map (fig. 336; ABOVE).
We estimated uncompacted bulk densities for individual observation sites
by dividing the uncompacted thickness into the the mass per unit area.
Thickness, mass, bulk density, and mean grain size generally decrease with
distance from the volcano (figs. 339, 342). The decrease in bulk density
reflects the depletion of crystal and lithic grains and the relative enrichment
of the lighter pumice and glass shards downwind. This effect has been documented
in other studies (Larsson, 1937). Packing of grains also plays a large
if not dominant role in the decrease of bulk density downwind. Compaction
by rain alone commonly effects a twofold increase in bulk density, indicating
that newly fallen ash was very loosely packed. The angular and irregular
glass and pumice shards that compose a progressively greater portion of
low-density downwind ash are more loosely packed than are the denser, more
equant crystal and lithic grains. The average bulk density calculated for
Missoula, Mont., is very low (0.11 g/cm3), although the data
on uncompacted thickness there are sparse, and the error in measuring the
very thin layer of ash is significant.
| START & IMAGES |
|