|
|
|
|
|
|
|
|
|
|
|
|
|
 |
Volcanic Events, pg. 2 Mount St. Helens History, pg. 3-15 Eyewitnesses, pg. 53-67 Absolute Times, pg. 81-82, 86 Activity Sequence, pg. 127-134 Gas Studies, pg. 190-191 |
Chemical
Compositions, pg.
233-250
Ash Clouds, pg. 323-333 Blast Dynamics, pg. 379-400 Rapid Deposition, pg. 466-478 Phreatic Explosions, pg. 509-511 New Lava Dome, pg. 540-544 Ash-Fall Deposits, pg. 568-584 Water Chemistries, pg. 659-664 River Water Quality, pg. 719-731 |
THE 1980 ERUPTIONS OF MOUNT ST. HELENS, WASHINGTON
RADAR OBSERVATIONS OF ASH ERUPTIONS
By DAVID M. HARRIS, WILLIAM I. ROSE, JR.1,
ROBERT ROE2, and MARTIN R. THOMPSON3
1Department of Geology, Michigan Technological
University, Houghton, Mich. 49930.
2U.S. National Weather Service, 5420 N.E.
Marine Drive, Portland, Oreg. 97218.
3U.S. National Weather Service, 3101 Auburn
Way S., Auburn, Wash. 98002
ABSTRACT
Radar systems located at Portland, Oreg., Seattle, Wash., and near Spokane, Wash., have been used extensively for observations of ash clouds from explosive volcanic eruptions at Mount St. Helens during 1980. Eruption clouds are composed of silicate particles and are therefore detectable by radar. Radar observations can be made at night and in overcast weather when conventional observations of eruptions are difficult.
Radar observations show that
the May 18, 1980, eruption lasted about 9 hr and had a column height of
at least 14 km relative to sea level for most of the period. During the
eruption, there were four periods of increased column height, which correlated
with the appearance of individual, dense ash clouds shown on the radar
plan position indicator (PPI) screen. The examples of radar observations
described here demonstrate the potential of radar for measuring the heights
of eruption columns, determining the duration of eruptions, and determining
the direction and rates of ash cloud movements downwind from the volcano.
If the particle size distribution within an ash cloud is known or can be
estimated, then radar observations may, in principle, provide the additional
data required to estimate the mass of ash suspended in the cloud and potential
ash-fall amounts over specified areas.
INTRODUCTION
Public safety could be enhanced if the locations, times, and amounts of potential ash fall could be accurately predicted during an eruption. The need for a rapid, remote-sensing method and a sound scientific basis for inferring the amount of volcanic ash that is in the atmosphere downwind from a volcano is obvious. The purpose of this paper is to illustrate the theory and application of radar to volcanic-ash clouds. Our understanding of ash-fall processes and our abilities to forecast ash fall may increase as a result of radar observations of ash clouds.
The use of radar to observe ash eruptions and to track ash clouds away
from their sources is a new and significant area for volcanological research.
Johnston (1978) cited radar measurements made in Alaska during eruptions
of Augustine volcano in January 1976. Radar measurements of eruption column
heights over Augustine were made at the National Weather Service (NWS)
office in King Salmon, Alaska, and at Sparrevohn Air Force Base, apparently
the first radar observations of airborne volcanic ash in the United States.
In March 1980, David Johnston advised the NWS in Portland and Seattle that
weather surveillance radar might be used to observe the growth, width,
tops, and movement of major eruption clouds from Mount St. Helens. Two
of the authors (Rose and Harris) also made requests for radar observations
of ash clouds and eruption column heights without knowledge of Johnston's
earlier discussions with NWS personnel, all of which led to the joint effort
by the NWS and USGS reported here.
ACKNOWLEDGMENTS
This study has benefited substantially from discussions with R. C. Srivastava
(Department of Geophysical Sciences, University of Chicago) and with M.
D. Krohn (USGS, Reston, Va.). We are grateful for the enthusiasm and interest
of the National Weather Service (Portland, Oreg., and Auburn, Wash.) and
the Federal Aviation Administration (Auburn, Wash.) in recording the volcanic
activity at Mount St. Helens.
DETECTION OF VOLCANIC ASH BY RADAR
The minimum concentration of volcanic ash required for detection by
radar is a function of the physical parameters of the particular radar
system, the size distribution and concentrations of particles in the ash
cloud, and the distance between the radar source and the cloud.
THE RADAR EQUATION FOR DISTRIBUTED TARGETS
Volcanic-ash clouds are similar to thunderstorms as radar targets. Ash clouds and thunderstorms cause backscatter of some of the energy that is incident on their constituent ash particles or raindrops. Particle fallout from ash clouds may involve the growth of ash particles by coalescence of smaller ones, a physical process that is also important in rainfall. Also, thunderstorms and ash clouds are large compared to the volume occupied by one pulse of the radar. Thus, the theory governing radar reflections from meteorological targets (such as thunderstorms) may be applied to radar reflections from ash clouds.
The development of theory governing radar reflections from randomly distributed targets (such as thunderstorms) was summarized by Probert-Jones (1962). He found errors in previous theoretical radar equations, produced a mathematically correct version, and showed that radar observations agreed with the new equation within the limits of experimental error.
| The summation, r6, is taken over all the particles of various
sizes in a unit volume of target space. Equation 1 above is valid when
the target completely fills the beam as defined by , ø,
and h at a particular range R. The actual gain, G, is
the antenna gain along the beam axis relative to an isotropic radiator.
The gain is related to the beam widths by
where k is a factor that corrects for the nonuniformity of illumination of the antenna (Probert-Jones, 1962); k is approximately unity for antennas of circular cross section. |
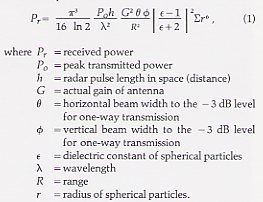
the received power (Pr) from a target composed of randomly distributed particles is:
|
Equation 1 includes four variables in addition to those specific to
a particular radar system. The terms
P0, h, , G, , and
ø are radar-system parameters and are constant for a particular
radar system. The term, |(e - 1)/(e + 2)|2, depends upon the
dielectric constant (e) of the particles. The term, r6,
depends upon the size distribution and number density of the particles
in the target. The term, 1/R2, depends upon the distance
(range) between the radar system and the target. The term for received
power, Pr, is a function of all of the above. Therefore,
for a particular radar system, the variables in the radar equation are
r6, 1/R2, e, and Pr. A solution
can be obtained if three of the variables are known.
REFLECTIVITY OF ASH CLOUDS
REFLECTIVITY
The reflectivity of a radar target is a function of the abundance of
particles and their scattering cross sections within the target. The reflectivity,
77, is the summation of the backscatter cross sections of the particles
per unit volume averaged over the radar pulse volume (Atlas, 1964). For
solid spherical particles which obey Rayleigh scattering, the reflectivity
is equal to:
The reflectivity, , does not appear explicitly in equation 1, but the
dependence of the reflectivity upon the particle-size distribution, number
density, and dielectric constant and wavelength are evident by comparing
equations 1 and 3. The dielectric constant, e, is that of the void-free
silicate glass and (or) crystals.
REFLECTIVITY FACTOR
The reflectivity factor, Z, is a parameter of the radar target; it is
equal to (2r)6, the summation of the sixth-power of the particle
diameter for all of the particles in a unit volume of target space. The
conventional units for Z are mm6/m3 (Atlas, 1964).
EFFECTS OF PARTICLE SHAPE ON REFLECTIVITY
In the case of volcanic-ash clouds, it is necessary to consider what effects, if any, the presence of voids and the occurrence of nonspherical particle shapes will have on the reflectivity. It has been shown (for instance, Atlas, 1964) that in relation to hail, enlarging an ice particle and filling voids in the particle with air changes the density, diameter, and dielectric factor in such a way that the particle's contribution to the reflectivity is unchanged. This argument also applies, by analogy, to vesicular silicate glass.
Studies of backscatter for nonspherical particles (see review in Atlas,
1964) show that the reflectivity varies as the particle shapes become more
distorted from that of a sphere, as the refractive index increases, and
as the orientations of the particles within a population become less random.
Preferred orientation of aspherical particles may increase or decrease
the reflectivity, depending upon how the long axes of the particles are
alined relative to the direction of polarization of the radar wave. For
a population of angular glass shards of various shapes and probably no
preferred orientation within an ash cloud, the increase or decrease in
reflectivity is probably small. Because the largest ash particles tend
to be equant (Rose and Hoffman, 1980 and 1981) and because these make the
largest contribution to the total reflectivity, failure to make corrections
for the angular shapes of glass shards in the smaller size ranges probably
is not significant.
RADAR TARGET PARAMETERS FOR ASH AND RAIN
Radar target parameters calculated for an ash cloud that was sampled by a research aircraft (Rose and others, 1980) are compared in table 31 with analogous parameters for warm orographic rain and thunder-showers. The comparisons are helpful in determining whether such an ash cloud should be detectable by radar. Radar target parameters for the ash cloud are most similar to those for warm orographic rain even though their reflectivities differ by an order of magnitude. However, because the reflectivity factor depends on the sixth power of the particle diameter and on the number density of particles, the reflectivity factor for the ash cloud would increase nearly an order of magnitude (by a factor of 8) if the particle diameters were increased from 0.15 to 0.22 mm. Furthermore, the greater refractive index factor, |K|2 = |(e-1)/(e + 2)|2, for the ash particles as compared to the raindrops (0.36 versus 0.197) enhances the detect-ability of an ash target by nearly a factor of 2, relative to a rain target with identical particle size distribution and number density. Radar detection of volcanic ash would be further enhanced if there were either a larger number of density particles or larger particle diameters in the ash cloud compared to those shown in table 31.
Also, for a given concentration and size distribution of silicate particles
in a target, the reflectivity of an ash cloud varies inversely with the
fourth power of the radar wavelength used. Therefore, the wavelength is
an important consideration when evaluating the suitability of a particular
radar system for observations of volcanic ash. On the basis of these comparisons,
we can expect that detection of volcanic ash for the conditions shown in
table 31 would be similar to radar detection of orographic rain, particularly
because of similarities of particle diameter and particle concentrations.
DESCRIPTION OF RADAR SYSTEMS
The eruption of Mount St. Helens on May 18, 1980, was observed on three radar systems. Ash clouds were tracked on Federal Aviation Administration (FAA) radar systems located at Seattle and near Spokane, Wash. In addition, the NWS radar system at Portland, Oreg., was used to measure the height of the eruption column directly above Mount St. Helens. Although the locations and specifications for all three radar systems are given in table 32, only data obtained from the Portland and Seattle radar systems were used for quantitative calculations in this paper; data from Spokane were used only for qualitative tracking of the ash cloud.
The radar systems at Portland (NWS) and Seattle (FAA) differ greatly in peak transmitting power, vertical beam width, and wavelength. The 6.2° vertical beam width of the Seattle radar precludes its use for measurement of vertical dimensions of ash clouds, but the Portland radar is ideal for this purpose. The greater peak power of the Seattle radar as compared to that of the Portland radar does not result in a large advantage for the system because of the attenuating effects of the longer wavelength, shorter pulse length, and larger vertical beam width, all of which reduce the power received from a given target. Both systems have the capability for operation in contour-logging mode. In this mode, the power received from a target is measured, corrected for the 1/R2 range attenuation, and compared to particular reference levels. Then the selected levels are displayed on the radar's plan position indicator (PPI) and range height indicator (RHI) screens. This mode contrasts with ordinary operation in which the PPI and RHI screens display the images of the detected targets without regard to signal strength.
Attenuation of the radar beam by intervening rainfall was not a major
problem because clear weather prevailed for the May 18, July 22, August
7, and October 16-18 eruptions. However, we can evaluate the significance
of attenuation by rainfall for radar observations of ash clouds. Atlas
(1964) reviewed observations and theory on attenuation of radar signals
by snow and rain. The amount of attenuation depends on the wavelength,
raindrop size distribution and concentration, and path length through rainfall.
For the radar system wavelength at Portland (5 cm), attenuation by rain
is more important than for those operating at longer wavelengths (for example,
23 cm at Seattle). The rainfall attenuation coefficient per unit rainfall
rate (mm/hr) for one-way transmission at a wavelength of 5 cm is about
0.003 (dB/km)/(mm/hr) (Wex-ler and Atlas, 1963). For example, the amount
of attenuation expected from a 2-mm/hr rainfall rate and a 100-km pathlength
is about 0.6 dB, or about a 15 percent reduction of power. Attenuation
by rainfall would be a possible source of error in Portland radar observations
of Mount St. Helens when rain is present along the path.
MEASUREMENTS OF ASH-CLOUD DIMENSIONS
An important question is whether radar observations can be used to measure
ash-cloud dimensions. A thorough discussion of radar measurements of storm
dimensions is given in Atlas (1964). The horizontal dimensions of radar-detected
ash clouds from the May 18 eruption exceeded the horizontal beam width
of the Seattle radar. The maximum reflectivity of typical ash clouds (at
a constant range) downwind from Mount St. Helens on May 18 corresponded
to a level 2 in the contour-logging mode (reflectivity equivalent to that
due to stratiform rainfall intensities of 2.5-12.5 mm/hr). However, within
the eruption column over the volcano, the maximum reflectivity observed
corresponded to a level 4 (reflectivities equivalent to those due to stratiform
rainfall intensities of 25-50 mm/hr). The observed ranges in reflectivity
in eruption columns and ash clouds from Mount St. Helens are less than
those of severe storms, and therefore, accurate measurements of ash-cloud
dimensions are possible. False echoes (spurious reflections) caused by
radiation from the side lobes of the antenna beam, which could have indicated
erroneous column heights, have not been detected. Furthermore, our observations
of eruption columns show that the reflectivity decreases rapidly near the
radar-detectable tops. Column heights were measured with the Portland radar
and have been corrected for curvature of the Earth and for beam width;
the latter correction involved subtraction of one-half beam width. The
degree of correspondence between the visible boundary of an ash cloud and
its boundary as detected by radar is not known.
RADAR OBSERVATIONS OF THE MAY 18 ERUPTION
ASH EMISSION AT MOUNT ST. HELENS
The May 18 eruption began at 0832 PDT, and the Plinian eruption column which resulted was observed on radar. The height of the eruption column (directly above Mount St. Helens) was measured at the Portland NWS office from 0900 to 2200 PDT (fig. 190). The height of the eruption column exceeded 14 km (relative to sea level) for most of the eruption, 9 hr, and the maximum reflectivity level observed for the column varied from 2 to 4 during the eruption. Periods of increased column height generally correlated with increased reflectivity, especially between 0840 and 0900 PDT, and from 1030 to 1230, 1330 to 1400, and 1600 to 1700 PDT.
Particle-size studies of the May 18 ash indicate a multimodal distribution,
with size peaks at 90, 25, and 10 m (Rose and Hoffman, 1980, 1981;
Sarna-Wojcicki, Shipley, and others, this volume). Terminal velocities
would have been too slow for the fine particles to have settled individually,
and they probably fell as composite particles of about 90 m in diameter,
possibly enhancing the radar reflectivity of the ash cloud. Sulfate coatings
on ash particles (Rose, 1977; Rose and others, 1980; Nehring and Johnston,
this volume) probably were too minor during the May 18 eruption to have
significantly influenced the radar reflectivity.
TRACKING OF ASH CLOUDS
At hourly intervals on May 18, Martin Thompson traced the radar images of ash clouds as displayed on the radar PPI screens of the Seattle and Spokane radar systems. (These radar systems are operated remotely by the FAA Seattle Air Route Traffic Control Center in Auburn, Wash.) Thompson's tracings are composites from the two radar systems and are shown in figure 191. The horizontal boundaries of the ash plume, as seen in National Oceanic and Atmospheric Administration (NOAA) satellite images, are also shown. The satellite images reveal the overall shape of the entire cloud and of the high-altitude ash trajectory, whereas radar pulses penetrate the ash clouds and are partly reflected by particles within the dense cores of ash clouds. The radar-detectable ash clouds were mostly within the broad plume shown on satellite images.
The radar images in figure 191 show details of the shape of the denser
portions of the eruption cloud at hourly intervals. Several of the images
show more than one discrete ash cloud (for example, images from 1340 and
1440 PDT). Successive appearances of these discrete ash clouds near the
volcano correlate with increases in column height and, we believe, reflect
increases in the eruption rate (for example, fig. 190 and table 33). The
times of increased column height (eruption rate) (beginning at approximately
0845, 1015, 1245, and 1600 PDT) are interpolated from figure 191 to the
nearest quarter hour because we do not have a continuous record of ash-cloud
sizes and column heights. The data are sufficient, however, to demonstrate
that the column height and therefore the eruption rate varied substantially
during the 9-hr eruption.
DIMENSIONS OF THE INITIAL ASH CLOUD
The plan area of the initial ash cloud, as detected by radar, appeared
largely unchanged from 0940 to 1040 PDT; however, the plan area increased
from 1040 to 1140 PDT as the ash cloud moved farther from Mount St. Helens
volcano and began to be tracked on the Spokane radar system. The initial
ash cloud contained much of the ash erupted in the Plinian column at Mount
St. Helens from about 0832 to 0900 PDT on May 18. The portion of the cloud
from which level-1 radar echoes could be detected on the Seattle radar,
as measured at 1040 PDT, had a plan area of 4,900 km2. The range
between Seattle and the center of the cloud was about 190 km. At the ash-cloud
location, the vertical beam width (from the Seattle radar) would have been
about 20 km and the horizontal beam width would have been about 4.6 km.
The ash-cloud thickness is not known, but is estimated to have been about
12 km. Thus, the ash cloud may only have intersected about 60 percent of
the radar pulse volume. However, correcting for this is not justified because
the ash-cloud thickness and variation of reflectivity as a function of
height within the ash cloud were not measured. The estimated volume of
the radar-detectable ash cloud is 5.9 X10⁴ km3.
REFLECTIVITY FACTOR INFERRED
FROM RADAR OBSERVATIONS
The minimum value of the reflectivity factor (Z) required for detection
of the ash cloud was determined from the radar equation 1, the antenna
gain equation 2, the range (R = 190 km) to the center of the ash
cloud, and the parameters for the Seattle radar system (table 32). We assumed
that the power received (Pr) from the radar-detected
ash cloud was equal to the detection limit (8x 10-15 W) of the
radar system. The dielectric constant
(e) of the silicate particles
(mostly dacitic glass) from Mount St. Helens was assumed to be 5.5 for
the wavelength (23 cm) of the Seattle radar. Campbell and Ulrichs (1969)
measured the dielectric constant of obsidian from Newberry caldera, Oregon,
and obtained a value of 5.5 for a wavelength of 8.6 cm. The minimum value
of the reflectivity factor for the ash cloud is 8.5 mm6/m3.
The minimum reflectivity factor inferred for the May 18 ash cloud (0832-0900
PDT) exceeds those shown in table 31 for warm orographic rain and light
thunder showers.
METHOD FOR ESTIMATING POTENTIAL ASH FALL
THE FIRST ASH CLOUD FROM THE MAY 18 ERUPTION
The volume of airborne volcanic ash, and therefore the potential ash
fall, depends on the plan area, the vertical thickness, and the mean particle
concentration of the ash cloud. The most reliable radar data for estimates
of ash volume are likely to be those obtained before substantial amounts
of particle coalescence and ash fall occurred, because the particle-size
distributions within clouds during ash fall are not known. If a substantial
amount of particle coalescence has not occurred, then the particle size
distribution within an ash cloud may be approximated by the size distribution
of air-fall ash for the eruption. These considerations suggested that the
1040 PDT image (Seattle radar) of the first ash cloud was the best one
for which a crude estimate of potential ash fall might be made.
PARTICLE CONCENTRATION INFERRED FROM REFLECTIVITY FACTOR
The silicate-particle concentration of the ash cloud can be inferred
from the reflectivity factor (Z = (2r)6), if the size
distribution of particles in the ash cloud is known.
PARTICLE-SIZE-DISTRIBUTION MODEL
The silicate-particle concentration in the cloud can be estimated for
a particle-size-distribution model that approximates the measured size
distribution of the May 18 air-fall ash in eastern Washington. We modeled
the particle-size distribution in the ash cloud by assuming that 25 percent
(by weight) of the ash particles were spheres of diameter 150 m, 50 percent
were spheres of diameter 100 m, and 25 percent were spheres of diameter
30 m.
REFLECTIVITY FACTOR PER UNIT MASS OF ASH
The reflectivity factors per unit mass of ash (for each particle size)
are 2.57 mm6/g (150 m), 0.764 mm6/g (100 m), and
2.06 x 10⁻² mm6/g (30 m). The weighted value of the
reflectivity factor per unit mass for the model size distribution is 1.0
mm6/g. The relative contributions of the three ash sizes to
the total reflectivity factor are 62.4 percent, 37.1 percent, and 0.5 percent,
respectively.
PARTICLE CONCENTRATION IN THE ASH CLOUD
The inferred concentration of silicate particles in the ash cloud, using
the observed reflectivity factor and the particle-size-distribution model,
is 8.5 mm6/m3/ 1.0 mm6/g = 8.5 g/m3.
This represents the concentration of ash in the first ash cloud downwind
from Mount St. Helens, 1.5-2 hr after it was erupted.
POTENTIAL ASH-FALL MASS AND VOLUME
The potential ash-fall mass can be calculated from the volume (5.9 X
104 km3) of, and the concentration of silicate particles
(8.5 g/m3) in, the radar-detected part of the ash cloud. The
calculated mass of ash is 5.0 X 10¹⁴ g. Similarly, the potential
ash-fall volume is about 0.20 km3, for a particle density of
2.5 g/cm3. These estimates represent the mass and volume of
ash remaining in the first ash cloud downwind from Mount St. Helens, 1.5-2
hr after it was erupted.
ESTIMATES OF POTENTIAL ASH FALL
In theory, the potential ash fall from the radar-detected part of the ash cloud can be estimated. The ash cloud, as detected by radar, was about 70 km wide and it traveled in an east-northeasterly direction at about 135 km/hr. The minimum potential ash-fall area (km2) and mean amount of ash (mm) could be estimated if either the duration of ash fall from the cloud or the ash-fall intensity (mm/hr) is known. The ash-fall intensity is the more important of the two parameters because it might be used, along with the quantities inferred from radar, to forecast the duration and the mean ash-fall amounts over the potential ash-fall area. Table 34 illustrates one procedure that might be used to estimate, in retrospect, the ash-fall intensity from the radar-detectable part of the initial ash cloud downwind from Mount St. Helens. The calculated ash-fall intensity is 13 mm/hr and it represents our best estimate for the peak ash-fall rate sustained for a period of about 30 min. Also, we have estimated the minimum potential ash-fall areas and amounts (table 35). These data suggest, in retrospect, that for any reasonable duration of ash fall, the impact from the first ash cloud of the May 18 eruption ought to have been great.
The prospects for making useful ash-fall forecasts from radar and field
observations appear good. However, such forecasting capability will require
additional detailed radar observations of ash clouds, measurements of ash-fall
intensities, studies of ash-fall mechanisms in eruption clouds, and comparison
of radar observations with the actual distribution, times, and amounts
of ash fall.
ONSET OF ASH FALL IN EASTERN WASHINGTON
Ash fall began at Tampico, Wash, (about 30 km west-southwest of Yakima), at about 1000 PDT. According to Seattle radar observations, the leading edge of the first ash cloud reached Yakima at about 0950 PDT and the trailing edge remained until after 1100. The same ash cloud, as tracked on the Spokane radar, reached Pullman, Wash., at about 1400 PDT (fig. 191), at which time ash fall began there (Hooper and others, 1980). Thus, ash fell for more than 4 hr from the first ash cloud as it moved from Tampico to Pullman.
According to photographs of eastern Washington on May 18, the ash cloud
obscured the sky for periods of up to several hours prior to onset of ash
fall at ground level. The duration of the obscured sky may be the time
required for the fine-grained ash to fall to the ground from heights of
5-20 km in the atmosphere. It seems likely that the secondary maximum of
ash-fallout thickness around Ritzville, Wash. (Sarna-Wojcicki and others,
this volume), may be due to the rapid eastward transport of finegrained
(and slowly falling) ash from the first (and possibly later) eruptive pulses.
ESTIMATES OF MAGMA ERUPTION RATE
The maximum height to which Plinian eruption columns rise is a sensitive indicator of the magma eruption rate (Wilson and others, 1978). Measured column heights from the Portland radar and calculated magma eruption rates for the May 18 eruption are shown in table 33. They show that magma eruption rates during the early part of the eruption (about 0845-0900 PDT) were an order of magnitude higher than during most of the remainder of the 9-hr eruption. The total magma volume, which is suggested by these rates, can be estimated by considering the duration of the eruption. From the data in table 33, a total volume of about 0.15 km3 of dense dacite is suggested. This estimate assumes high efficiency of heat transfer to the atmospheric air entrained by the rising Plinian column, an efficiency which is not achieved in the case of pyroclastic flows. It also assumes that no interaction of ground water with magma occurred. Both of these assumptions are probably incorrect and will result in underestimation of the true magma volume. (See also Wilson and others, 1978.)
Such calculations illustrate that an "order of magnitude" volume estimate
can be obtained from column-height measurements if the duration of the
eruption is also known. Using radar data for later eruptions (for example,
from table 36), we calculated dense-magma volumes of 0.002, 0.003, 0.003,
0.001, and 0.001 km3 for the eruptions of May 25, June 12, July
22, August 7, and October 16-18, 1980, respectively. These calculations
illustrate the much smaller magnitudes of these later eruptions of Mount
St. Helens, as compared to the May 18 eruption.
CONCLUSIONS
Radar observations show that the Plinian eruption of Mount St. Helens on May 18 lasted for about 9 hr. The maximum height of the Plinian eruption column (> 24 km above sea level) was attained several minutes after the eruption began (0832 PDT); however, by 0900 PDT the column height immediately over the vent was only about 16 km and continued to decrease. After 0900 PDT, the height of the eruption column exceeded 14 km for an additional 8 1/2 hr. During the 9-hr eruption there were four periods of relatively increased height and reflectivity of the Plinian column, which probably resulted from increased rates of ash emission. Radar observations of discrete ash clouds downwind from the volcano also suggest that the eruption had four distinct relative maxima in the rate of ash emission.
A mean particle concentration of 8.5 g/m3 is inferred for the first ash cloud downwind from Mount St. Helens, about 1.5-2 hr after the 0832-0900 Plinian eruption. The mass of silicate particles in the cloud (5 X 10¹⁴ g) was estimated using the total ash-cloud volume (5.9 x 10⁴ km3) and the particle concentration. The potential ash-fall volume calculated for the radar-detected portion of the ash cloud is 0.20 km3.
Radar observations of Plinian eruptions at Mount St. Helens subsequent
to the May 18 eruption show that the later ones were of shorter duration
and erupted much smaller volumes of ash as compared to the May 18 eruption.
| START & IMAGES |
|