|
|
|
|
|
|
|
|
|
|
|
|
|
 |
Volcanic Events, pg. 2 Mount St. Helens History, pg. 3-15 Eyewitnesses, pg. 53-67 Absolute Times, pg. 81-82, 86 Activity Sequence, pg. 127-134 Gas Studies, pg. 190-191 |
Chemical
Compositions, pg.
233-250
Ash Clouds, pg. 323-333 Blast Dynamics, pg. 379-400 Rapid Deposition, pg. 466-478 Phreatic Explosions, pg. 509-511 New Lava Dome, pg. 540-544 Ash-Fall Deposits, pg. 568-584 Water Chemistries, pg. 659-664 River Water Quality, pg. 719-731 |
THE 1980 ERUPTIONS OF MOUNT ST. HELENS, WASHINGTON
FLUID DYNAMICS OF THE MAY 18
BLAST AT MOUNT ST. HELENS
By SUSAN WERNER KIEFFER
ABSTRACT
The lateral blast that was the first phase of the May 18 eruption of Mount St. Helens devastated an area of about 500 km2 north of the volcano. Preliminary mapping of the direction of fall of the trees in the devastated area shows that two major, irregularly shaped zones can be defined: (1) an inner zone, termed the "direct blast zone," in which the flow of the blast was approximately radial from the volcano and was relatively undeflected, in plan view, even by large topographic features, and (2) an outer zone, termed the "channelized blast zone," in which the flow followed or was deflected, in plan view, by the local topographic features. Streamlines of the flow were thus not simple radii from the source. The blast was a supersonic expansion of a multiphase (vapor-solid-liquid) mixture from a reservoir at a pressure much greater than that of the atmosphere into which it expanded. The model for the flow presented here explains the existence of the two blast zones, characteristics of the transition between the devastated area and surrounding undamaged forest, and many of the eyewitness and instrumental observations of the blast. The model can easily be scaled with pressure, temperature, and dimensional ratios, but plausible initial conditions used here for illustration are: a reservoir pressure of 12.5 MPa (megapascals) (125 bars), a temperature of 600K (327°C), and a solid-to-vapor mass ratio of 25.
The eruption is assumed to have been triggered by the landslide failure of the north slope, with the resulting formation of a nearly vertical face (the vent) through which the blast emanated. The discharge developed as rarefaction (expansion) waves propagated into the reservoir and as the gases in the hydrothermal and (or) magmatic system inside of the mountain expanded. Unsteady flow developed into steady flow, having an initial (choked) velocity equal to the speed of sound of the moving reservoir fluid, about 100 m/s (meters per second).
As the material discharged from the vent at sonic velocity, it expanded supersonically in all directions. Because of the high pressure of the reservoir fluid relative to that of the surrounding atmosphere, the flow expanded more than 90° laterally (96°), both east and west of the approximate northerly direction of the normal to the plane of the vent. Rarefaction waves emanating from the corners of the vent reflected from the boundary between the flow and the atmosphere, and became compression waves that coalesced into weak peripheral shocks subparallel to the flow boundary. These weak shocks joined to form a strong Mach disk shock about 11 km from the vent. The reflection of the rarefaction waves into compression waves resulted in a northerly deflection of the margins of the flow away from the initial east and west directions. This deflection saved the lives of some observers initially in line with the flow, for example, those in the South Fork Toutle River and parts of the North Fork Toutle River drainages.
As the flow diverged from the vent, the velocity increased and the pressure decreased rapidly; within about 6 km of the vent, the flow was overpressured relative to the atmosphere, but beyond this zone, the flow became strongly underpressured. A Mach disk shock formed at about 11 km in response to the zone of underpressure within the flow, and the flow velocities dropped from supersonic on the upstream side of the shock to subsonic on the downstream side. The boundaries between the direct and channelized blast zones probably correspond to the positions of the peripheral and Mach disk shocks. The solid particles entrained in the blast were a heat source for the expanding vapor, so that temperatures dropped only by about 20 percent from the vent to the limits of the blast zone. At the limits of the blast zone, the density of the flow had dropped below the density of the (dusty) atmosphere, so the blast cloud simply lifted from the ground and ramped upward into the atmosphere, leaving only a thin transition zone between the devastated area and the surrounding undamaged forests.
Although the flow, on the average, traveled at a velocity less than the speed of sound in air, so that strong atmospheric shocks were not generated near the volcano, the white clouds photographed on the periphery of the blast may have been condensation clouds formed in zones of negative pressure that followed passage of weak local atmospheric shocks. Sounds generated within the blast by the destruction of the forest, and mixing and transport of boulders, trees, and glacial ice blocks, were not heard by eyewitnesses for two reasons: first, sounds were focused downstream into cones of narrow solid angle (about 20°-30°) by the supersonic flow, and eyewitnesses outside of these cones would not have heard sounds; second, sound was attenuated more than 10,000 times as rapidly as in clear air by absorption of energy by the particles in the blast.
About half of the mass of
the blast was discharged through the vent in 10 to 20 s (seconds) at the
initial velocity of 100 m/s; the remainder followed at decreasing velocities.
Because of this range of initial velocities, as well as spreading of the
blast cloud due to basal friction, the duration of the blast increased
with distance from the vent. The maximum mass flux, during temporary steady
flow at the vent, would have been 0.6 X 10⁴ g/s/cm2
(grams per second per square centimeter), and the thermal flux would have
been 2.5 MW/cm2 (megawatts per square centimeter). The total
thermal energy released was 24 Mt (megatons), of which 7 Mt was released
during propagation of the blast through the devastated area, and 17 Mt
during penecontemporaneous condensation of the steam and cooling of the
condensed water and entrained solids.
INTRODUCTION
The first phase of the May 18 eruption was the lateral blast that devastated the conifer forests in a sector covering 500 km2 north of the volcano. The onset of the blast at 0832 PDT was widely recorded on barometers and seismometers, and gave instrumental amplitude variations comparable to those caused by detonation of nuclear devices in the 1-10 Mt range (Reed, 1980).
Usage of the word "blast" can be traced back nearly 1,000 yr (Oxford
English dictionary, 1971). For centuries its meaning was "a blowing or
strong gust of wind," for example, as used by Chaucer in 1338, "Reed that
boweth down with every blast." The usage implied an event of considerable
force and duration, for example, Dana in 1840, "Broken by the blast of
a hurricane." In the mid-1700's the word "blast" came into usage to mean
"a blowing up by gunpowder or other explosive," and with the advent of
the atomic era, the word came to denote an event that was almost instantaneous.
In this report, I show that, in its original context, the word "blast"
is an appropriate description of the events of the morning of May 18.
OBSERVATIONS OF THE BLAST AND ITS
EFFECTS TO BE ADDRESSED BY THE MODEL
The eruption began through a vent centered between about 1,900 and 2,500 m (6,300 and 8,000 ft altitude) about 1 km north of the old summit of the mountain (for example, see Moore and Albee, fig. 76). Eyewitness descriptions and photographs of the blast show that it was a roiling, turbulent gray cloud (Rosenbaum and Waitt, this volume). A preceding wind was reported in only a few places, and several eyewitnesses reported a wind blowing toward the volcano. In the photographs taken by Gary Rosenquist (fig. 38), a low cloud of dust appears in front of the advancing blast, indicating sufficient wind to entrain particles. Many witnesses heard no sound as the blast approached, except for dull rumbling probably associated with visible lightning flashes or with the landslide. Sequences of photographs show that the top of the blast appeared to travel faster than the bottom, and it therefore developed a towering or oversteepened appearance. Lenticular white clouds emanating from the edges were photographed from a number of positions around the edge of the advancing blast front.
A minimum velocity of 100 to 110 m/s, an average over the first 6.1 km in a northeast direction, has been deduced by Malone and others (1980). This velocity presumably is the velocity of the basal layer of the blast, which destroyed ground-based instruments. Keith and Dorothy Stoffel (oral commun., 1980), who were above the volcano in an airplane at the onset of the blast, estimated a similar velocity for the first laterally ejected material.
Barometric records from 30 stations in the Pacific Northwest show a systematic trend of peak-to-peak amplitude displacement with distance and orientation from the volcano (Reed, 1980). The record from Toledo, Wash., 54 km northwest of the volcano, shows a sharp rise of the pressure above ambient, followed by a drop to a comparable negative pressure, a slow recovery lasting for 13 min, and then another period of positive overpressure lasting 1 hr. The strongest peak-to-peak amplitudes extrapolate linearly to approximately 2 X 10⁴ Pa (pascals) (0.2 bar) at 1 km from the summit and to (5-8) X 103 Pa (0.05-0.08 bar) at 5 km.
The devastated area (the area in which trees have been uprooted, displaced, or knocked down) is a sector of about 500 km2 generally extending to the north of an imaginary east-west line through the new vent (fig. 219). However, high on the mountain, the southern boundary of the devastated sector actually bends south of this east-west line. This southern boundary sweeps northward east and west from the volcano, and trends about 30° north of due east and west at 10 to 20 km from the mountain. The northern boundary of the devastated area is irregular, but has two pronounced lobes extending to the northwest (25 km) and northeast (22 km). It is surrounded by a zone, referred to as the "singed zone," in which trees are still standing but have singed needles and limbs.
Preliminary mapping of the direction of fall of the trees in the devastated area by the author (see the summary of this work on pl. 1) shows two major, irregularly shaped zones (fig. 219): (1) an inner zone, termed the "direct blast zone," in which the blast flow was approximately radial from the volcano and was relatively undeflected, in plan view, by even large topographic features, and (2) an outer zone, termed the "channelized blast zone," in which the flow followed or was deflected, in plan view, by local topographic features. Streamlines of the flow were thus not simple radii from the source.
The transitions between the devastated area of downed trees, the zone of singed trees, and the surrounding forest of standing green trees have a number of remarkable characteristics that are explained by the blast-flow model that follows. The transition distance from the area of uniformly downed trees in the devastated area to standing trees in the singed zone is usually on the order of one tree length (fig. 220A). The singed zone is narrow compared to the dimensions of the devastated area; it ranges in width from a few meters to 4 km. Commonly, the zone is wider on ridges and slopes facing toward Mount St. Helens than on slopes facing away (figs. 219, 220A).
In vertical cross section, the local topography had a pronounced effect on the blast flow. Within the direct blast zone, as the flow crossed terrain that dropped in elevation (for example, crossed from a ridge to a valley or from the top of a cirque wall to a lake below), parts of the flow reversed direction, and reverse tree blowdown patterns were formed. A spectacular example occurs at Fawn Lake (fig. 220B). These tree reversals are less common in the channelized blast zone.
Ground reconnaissance studies conducted by the author in May 1980, and detailed studies by Moore and Sisson (this volume), showed a complex variety of tree destruction mechanisms. Field observations indicated that the devastation was not produced by an airshock alone, but by a complex multiphase flow of finite duration. Some of the evidence for this conclusion is that splinters remaining after tree breakage were deformed away from the center of the volcano by a flow that was sustained after the trees fell over (fig. 220C), root balls on fallen trees are deformed away from the source of the blast, and rocks and splintered wood are deeply driven into previously splintered trunks (fig. 220D) and into deformed root balls.
The total blast deposit is approximately 0.25 X 10¹⁵ g (Moore
and Albee, this volume) and consists of at least three components: lithic
fragments derived from the older volcanic edifice; a scoriaceous gray dacite;
and organic material and soils entrained as the eruption progressed. The
volatile components in the blast probably came from both the dacite and
surrounding hydrothermal water. The material in the blast was, therefore,
a complex multiphase vapor-liquid-solid mixture.
ASSUMPTIONS USED IN THE
MODEL OF BLAST DYNAMICS
In order to model the fluid dynamics of the blast, both the reservoir geometry and the thermodynamic conditions must be greatly simplified from the complex pressure, temperature, and material composition conditions that probably existed in the volcano. The reservoir was certainly heterogeneous in composition, containing the gray dacite, parts of the mountain's hydrothermal system, and cold rock and glacial ice; however, much of the initial compositional and thermal heterogeneity was erased in the early stages of flow of the blast by turbulent mixing of the components. Disregarding the problem of phreatic, magmatic, or phreatomagmatic mechanisms, the process is here modeled in terms of an eruption from a reservoir initially at a uniform pressure, temperature, and density, and having a specified mass ratio of solid to vapor phases (m) (fig. 221A).
The reservoir is assumed to have been a disk-shaped volume of the north
side of the mountain just large enough to contain the mass (0.25 X 10¹⁵
g) ejected by the blast, 0.2 km3 at an average preemption density
of 1.3 g/cm3 (Moore and Sisson, this volume), or 0.12 km3
at a preemption density of 2.0 g/cm3. The reservoir is assumed
to have had a frontal surface area of 0.25 km2 (that is, the
plane called here the "vent" is assumed to have been a rectangle 1 km in
east-west dimension and 0.25 km in height) and, therefore, to have been
0.5 km deep.
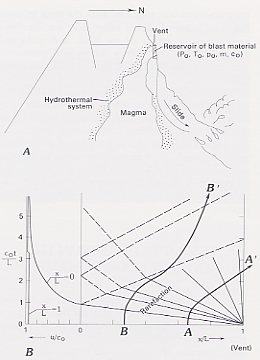 |
Figure 221.--Sketches of volcano and reservoir before the blast and development of reservoir discharge. A, Schematic cross section of volcano and reservoir conditions before the blast, as assumed in model for blast dynamics. Uniform reservoir conditions are assumed: P0, initial pressure; T0, initial temperature; p0, initial density; m, mass ratio of solid to vapor components; c0, initial sound speed. The eruption emanated through the vent created by the landslide down the north flank. It is assumed that magma underlay and partially intruded the disk-shaped area (reservoir) from which the blast material originated. The magmatic heat probably created a hydrothermal system in the reservoir of blast material. B, Space-time diagram showing development of discharge from reservoir. The multiphase rarefaction fan originated at vent, x/L = 1, and propagated into reservoir, reflecting from back of reservoir (x/L = 0), which is assumed to be at constant pressure. Distance is normalized to reservoir depth, and time is normalized by ratio of sound speed, c0, to reservoir depth, L. Shown on the left is a graph of velocity of the blast (normalized to reservoir sound speed) versus time (normalized by the ratio of sound speed to reservoir depth). Curve labeled x/L = 1 shows velocity of very shallow material; curve labeled x/L = 0 shows velocity of very deep material. Illustration is schematic, modified from Shapiro (1953, 1954). |
The blast is modeled as flow from a one-dimensional reservoir. The initial pressure, P0, is taken as a plausible mean pressure between the top and the bottom of the reservoir (overpressures within the magma chamber are unknown at this time, but, as is shown later, pressures higher than a mean hydrostatic pressure are not required to explain the blast phenomenon). The initial temperature, T0, is here taken to be the saturation temperature of pure H2O at the initial pressure P0, but it may also be considered to be an averaged temperature intermediate between the dacite at its solidus temperature, warm hydrothermal water, and cold rocks and glacial ice. The reservoir composition is specified simply by a mass ratio of solid to vapor phases, m, even though the material in the blast likely came from both a dacitic magma intrusion and from a surrounding hydrothermal system, and, therefore, had rather large variations in solid-vapor ratio as well as in initial temperature.
The equation of state of the material that expanded from the reservoir is modeled by considering the material to be a multiphase fluid consisting of two thermally interacting components: a vapor phase and an entrained solid phase. For this model, the vapor phase is taken to be steam; but because the flow characteristics are dominated by the abundance of the entrained solid phase, it would make only slight changes in the results if this phase were assumed to be another vapor, such as CO2. The density of the entrained solid phase is assumed to be 2.0 g/cm3.
Upon adiabatic expansion, the thermal history of a multiphase mixture can lie between two extremes: the first, in which the vapor and solid phases do not interact thermally, and the second, in which the particles and vapor are at all times in thermal equilibrium. Because of the large amount of fine-grained material in the blast deposit (Moore and Sisson, this volume; Hoblitt and others, this volume), transfer of heat between the two phases was important during the blast flow and thus the second extreme is assumed here. The solid and vapor components are assumed to flow together (homogeneous flow). Transfer of mass between the solid and gas phases (for example, due to degassing of pyroclastic particles or to condensation of the steam on the solids as the flow expanded) is ignored because the scoriaceous nature of the dacite suggests that degassing from the magmatic component was restricted, and because temperatures throughout most of the area devastated by the blast were greater than the condensation temperature of water (about 92°C at 2,100 m elevation).
For an adiabatic, quasi-isentropic expansion, the mixture of vapor and solid particles described above can be modeled as a thermally equilibrated pseudogas and can be characterized by equations of state of the form of the perfect gas laws (Wallis, 1969):
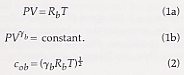 |
In these equations, P is the pressure, V is the volume, Yb is the isentropic exponent, Rb is the gas constant of the blast mixture, T is the temperature in Kelvin, and cob is the sound speed of the blast mixture in the reservoir. Yb and Rb are appropriately modified from the values of the pure vapor phase to account for the effect of the entrained solids in the mixture: |
 |
where Cp and Cv are, respectively, the specific heats at constant pressure and volume; the subscripts g and s denote the gas and solid phases, and m is the mass ratio of solid to vapor components. Notice that because of the dominant effect of m in the above equations, the molecular nature of the vapor phase is generally less important in determining the thermodynamic properties than the mass abundance of the solid phase.
Although the blast-flow model can easily be scaled (for constant Yb
the results scale linearly with dimensional and pressure ratios, and as
the square root of temperature ratios), the model is presented here for
a single set of plausible initial conditions at Mount St. Helens. It is
assumed that 10 percent of the volume that flowed into the blast was initially
filled with liquid water that vaporized during the eruption; this assumption
gives m = 25. For this value of m, 7b = 1.04, and Rb
= 17.8 X 10⁴ ergs/°C/mole. The initial source pressure
is assumed to have been 12.5 MPa (125 bars), appropriate to 0.65 km of
overburden, and the initial temperature is assumed to have been 600K (327°C),
the saturation temperature of pure H20 at 12.5 MPa. The initial
density of such a mixture at 12.5 MPa pressure would have been 1.0 g/cm3.
Atmospheric pressure is taken as 8.7 X 10⁴ Pa (0.87 bar).
INITIATION OF THE ERUPTION, AND THE
DEVELOPMENT AND DURATION OF DISCHARGE
The Mount St. Helens blast was initiated by the removal of the overburden contained in the landslide, an event that resulted in the sudden exposure of volatile material in a reservoir at high pressure to much lower pressure. The removal of the overburden is considered instantaneous for purposes of modeling reservoir discharge. The geometry, simplified as discussed above, is shown in figure 221A, and the events that followed the overburden removal are shown in figure 221B, a space (x)-time (t) diagram of wave and particle motions. The initial conditions for the model are that the reservoir contained a fluid, initially at rest, with the thermodynamic properties discussed above, bounded by a rigid wall 500 m behind the vent. At time t = 0, the pressure at the plane of the vent was instantaneously reduced to that of the atmosphere.
The rarefaction (decompression) that propagated into the reservoir was complex, and consisted of at least three parts: a precursor rarefaction that reduced the pressure to that of saturation of the material; a vaporization wave, across which the vapor phase nucleated and grew and some acceleration may have occurred; and a multiphase expansion wave that accelerated the mixture of vapor and solid material from the vent. Further discussion of this series of waves is given in Appendix 1, "Precursor, vaporization, and multiphase expansion waves"; to simplify the model, the multiphase expansion wave is assumed to have accomplished the major part of the acceleration of the blast material, and it is referred to as "the" rarefaction wave.
A rarefaction wave travels into a fluid at the speed of sound of the fluid, 105 m/s for the assumed multiphase reservoir fluid at Mount St. Helens. The wave was initially a discontinuity as it began at the vent at t = 0, but, because the speed of sound in the fluid decreases with decreasing pressure as the fluid expands, the wave spread out with time (as represented by the rarefaction fan on the x-t diagram of fig. 221B). The particles in the reservoir accelerated as they crossed the rarefaction wave, reaching sonic velocity, u = c (where u is the particle velocity and c is the local sound speed) as they crossed the vertical part of the rarefaction fan at the exit of the reservoir (the vent). This local sonic velocity is 103 m/s for the assumed reservoir conditions. At the vent, the pressure was still above ambient; further expansion to lower pressure could not take place inside the reservoir and had to occur outside of the vent, a process discussed in the section on "Steady state expansion from the vent."
The head of the rarefaction wave reflected from the bounding surface of the reservoir, with the boundary condition that the particle velocity, u, on this surface must have remained zero. The reflected wave traveled back through the reservoir to the vent, arriving at a time, D (after initiation of the eruption), that is slightly less than 2 L/c0b (where L is the depth of the reservoir and c0b is the sound speed of the material at rest in the reservoir). D is 10 s for the model. Particles, such as AA' in fig. 221B, that escaped the reservoir before interacting with this wave exited with the maximum (sonic) velocity; particles, such as BB', that were caught by the reflected wave, had slower velocities. In principle, some material never left the vent because of the boundary condition u = 0. However, material originating a length of l/L from the closed end of the reservoir would have expanded to l'/L, given by ------ where V and V are the specific volumes in the reservoir and at atmospheric pressure, respectively. Because the final expansions were so large (V'/V is about 103), l'/L is greater than 1 for all (l/L) > 10-3, that is, most of the material ultimately left the vent, though with ever-decreasing velocities. In fact, about two-thirds of the material left the vent before the arrival of the reflected wave. It is reasonable, therefore, to define the "duration of the blast at the vent" as (1-2) x D, or as 10-20 s. The duration is certainly dependent on the assumed reservoir geometry; for example, an extreme case would be a long, small-diameter reservoir, but this shape is not realistic because the vent created by the landslide scarp was nearly 1 km in diameter, and the total mass in the blast deposit therefore requires a disk-like shape.
The reservoir was at such high pressure compared to the ambient atmospheric
pressure that the flow choked at the vent and exited at the choked or sonic-flow
velocity (Shapiro, 1953-54). For unsteady flow, the choked velocity is
------ where cob is the speed of sound of the mixture
at rest in the reservoir; the subscript us refers to unsteady flow
conditions, and the superscript asterisk denotes sonic flow conditions.
cob is given by ------ For the mixture postulated, cob
is 105 m/s, and the unsteady-flow choked velocity is 103 m/s. Passage
of the transient rarefaction waves allowed steady flow to develop, and
the sonic or choked velocity to increase to the steady-state value of ------
which is 104 m/s. Under steady-flow conditions, the pressure at the vent
would have decreased to P* = 0.60P0 (7.5 MPa, or 75 bars), the
temperature to T* = 0.98T0 (588 K (315°C), and the density
to p* = 0.61p0 (0.61 g/cm3). The mass flux, controlled
at the vent by choking, was ------ where p*, u*, and A* are,
respectively, the density, velocity, and area at sonic conditions at
the vent. For the calculated p* and u*, the mass flux per
unit area was 0.6 x 10⁴ g/s/cm2. With an average
temperature 325K above ambient, a specific heat, Cp, of 0.84 X 10⁷
ergs/g/K for the solid phase and 4.2 X 10⁷ ergs/g/K for
the steam, and a latent heat of vaporization of the steam, L, of 2.2 x
1010 ergs/g, the thermal-energy flux or power per unit area
was ------ For the model conditions, E* was 2.5 X 10¹³ ergs/s/cm2
or 2.5 MW/cm2. (For comparison, the power per unit area
developed by the Advanced Saturn 5 Stage 1 motors that launched the Apollo
astronauts to the moon was about 1 MW/cm2.) The horizontal thrust
was ~ 3.3X10¹² Newtons.
THE MODEL FOR STEADY-STATE
EXPANSION FROM THE VENT
Material discharged from the vent into the atmosphere at sonic velocity would have expanded super-sonically in all directions. In the vertical direction, the expansion would have been complicated by gravitational accelerations and by the ground surface. In lateral directions, the expansion could have occurred relatively unimpeded. The model presented in this section represents the flow in a lateral plane through the blast cloud.
In the absence of gravity, friction, phase changes, and addition or loss of mass from a flowing fluid, the steady-state equations of motion for an expanding fluid are (Thompson, 1972): ------
In these equations, p is the density, u is the vector velocity, P is the pressure, V is the spatial differential operator. These equations, supplemented by the equation of state of the fluid and boundary conditions, define the steady-state condition of the flow everywhere. However, they are not analytically solvable because they are nonlinear. The method of characteristics was used for solution because it explicitly defines waves within the flow.
A detail of the expansion of the flow around a corner of the vent, for example, the east corner (fig. 222A), illustrates some of the phenomena of supersonic flow that the model suggests occurred during the blast. Streamlines of the flow are shown as heavy lines A'B' and AB. The characteristics of the flow are shown as thin black lines, radiating from the corner of the vent; they are labelled by the Mach numbers of the flow, M, as it crosses the characteristics. Physically, the characteristics of the flow can be thought of as small sound waves, in this case, expansion waves, across which the fluid diverges and accelerates (the Mach number increases) and the pressure decreases. The fluid expanded around the corner of the vent because its pressure was much larger than the atmospheric pressure. The angle of expansion was determined by the ratio of fluid pressure to atmospheric pressure, the Mach number of the flow, and the thermodynamic properties of the fluid (the angle of expansion is the Prandtl-Meyer angle, well known in aerodynamic studies). The deflection of the flow at any point on a streamline depended on the extent of passage through the rarefaction wave. Particles that originated close to the walls of the reservoir (for example, a particle on streamline AB in fig. 222A) were more rapidly accelerated to their final velocities than those closer to the center of the vent (for example, a particle on streamline A'B') which had to travel farther through the rarefaction fan. On figure 222A small arrows (d, e, f, g) show the degree of turning of particles through the rarefaction fan. These arrows might be thought of as the direction in which individual trees knocked down by the flow now point. Note that they do not point directly away from the origin of the flow at the vent. For example, tangent CC' on streamline A'B' does not point to the place where streamline A'B' left the vent. In particular, where the divergence exceeds 90°, a linear extrapolation of the directions of tree fall back to the vent would give an apparent flow origin in front of the vent. This fact illustrates that even close to the vent in the direct blast zone, streamlines of the flow are not simple radii from the source.
The actual flow from the vent was more complex than this simple example of corner flow because rarefaction waves from opposite sides of the vent intersected in a complex way, creating complex regions of intersecting expansion waves and regions of reflected compression waves that built into shock waves. The flow at Mount St. Helens depended on reservoir conditions and material properties that are unknown at this time, so that quantitative solutions are difficult to obtain, but general features of such expansive flows are illustrated schematically in figure 222B. Most data for the flow regimes come from development of propulsive engines (JANNAF, 1975), which are different in scale and material properties from the Mount St. Helens blast. These data and theories, nevertheless, are a valuable base for studying the process that may have occurred in the blast at Mount St. Helens.
Qualitatively, the following phenomena shown in figure 222B can occur in expansive flows. A rarefaction wave, initially identical to that discussed above, emanates from each side of a vent (corners x and x' in fig. 222B). The flow pattern is "simple" (in the fluid-dynamics sense of the word) near the vent, and the flow is initially deflected through the Prandtl-Meyer angle, v. As the expansion waves from opposite corners of the vent intersect (at y), the flow becomes "nonsimple" and differs from the simple flow shown in figure 222A. The pressure decreases as the flow passes through these simple and nonsimple rarefaction waves. It is equal to atmospheric pressure at the flow boundary but can fall considerably below atmospheric pressure near the axis of the flow.
When the rarefaction waves reach the boundaries of the flow, they are reflected as compression waves and coalesce into weak shocks, referred to as intercepting shocks because they intercept and terminate the initial rarefaction waves. The intercepting shocks consist of two parts, an incident and a reflected shock (S and S' in fig. 222B), connected by a Mach disk shock, in front of which the flow is supersonic (M> > 1) and behind which the flow is subsonic (M< 1). Downstream from the Mach disk shock, subsonic and supersonic regions of flow subparallel to the boundary are separated by discontinuity surfaces (D, fig. 222B). The pressure in front of the Mach disk shock is very low because the flow overexpands through the nonsimple region of the rarefaction waves. Consequently, there is a pressure gradient acting from the flow boundary, which is at atmospheric pressure, toward the underpressured core; this pressure gradient causes the flow boundary to curve inward away from the initial Prandtl-Meyer angle, as shown in figure 222B. A boundary layer that increases in thickness downstream develops because of interaction of the flow with the atmosphere.
The flow model for the boundary and reservoir conditions assumed above for Mount St. Helens is shown in figure 223. The phenomena described above are visible. The solution interior to the region bounded by shocks was obtained by hand calculations using the method of characteristics. The minimum pressure in this region was calculated from the numerical solution and checked from the method of Pack (1948). The location of the Mach disk shock was estimated by scaling from methods described in JANNAF (1975). The contour of the boundary of the flow was estimated from the methods described in JANNAF (1975). The position of the intercepting shock is entirely schematic, based on (1) the assumption that it was nearly tangential to the boundary near the vent because the angle of incidence of the characteristics onto the boundary equals their angle of reflection, and (2) connection to the Mach disk edges. Although numerical uncertainties could, in principle, be assigned to a model such as this, they are meaningless in view of the uncertainties in physical principles we still face in interpretation of the blast fluid dynamics.
In the model conditions assumed for the Mount St. Helens blast, the rarefaction waves that emanated from both sides of the vent deflected the flow through an initial angle of 96°. The reflection of the expansion waves from opposing boundaries deflected the flow from its initial angle of 96° to an angle of about 60° at x/d ~ 10. The fluid exited the vent at the sonic velocity of 104 m/s. At Mach 2.23 (near the vent) the flow was moving at a velocity of 225 m/s; at Mach 3.41, just in front of the inferred Mach shock disk, the velocity was 325 m/s.
Within the diverging flow, the pressure dropped rapidly away from the vent. At the boundary of the flow, the pressure was reduced to the local atmospheric pressure. The pressure contours (fig. 223) show that the pressure dropped below ambient outside of a zone about six vent diameters distance. This zone of negative pressure is shown as stippled in figure 223. The calculated pressure drop is to about one-half of ambient, but absolute pressure values are not very significant because of the effect of hydrostatic pressure, ignored here, on different parts of the flow. However, the existence of a low-pressure region within the flow is significant. This low-pressure core formed because the compression waves could not be reflected back into the flow quickly enough to prevent overexpansion.
As the pressure within the flow decreased, the density likewise decreased rapidly. Temperatures, however, were rather uniform across the flow because of the buffering effect of the entrained solid phases that acted as a heat source for the expanding vapor. At the limits of the blast zone, the temperature only dropped to 80 percent of the initial value. The heat supplied to the vapor by the solids augmented the density decrease caused by the extreme volumetric expansion.
In response to the formation of the low-pressure core, the intercepting shocks would have connected across the flow to have formed a Mach disk shock. Across this shock, the pressure increased from the subatmospheric values toward atmospheric pressure, and the flow decelerated from supersonic to subsonic velocities. Based on scaling relations given in JANNAF (1975), the Mach disk is shown in figure 223 (BELOW) at a distance x/d ~ 11 and having a diameter s/d = 8. The pressure, density, and velocity changes across the shocks cannot be calculated at this time, because the numerical model is only valid inside at the shock waves. Under the assumption that the shocks were not too strong, the model has been extrapolated across them (as shown in fig. 223) to obtain estimates of density and temperature, estimates that are necessary for prediction of the range of the flow.
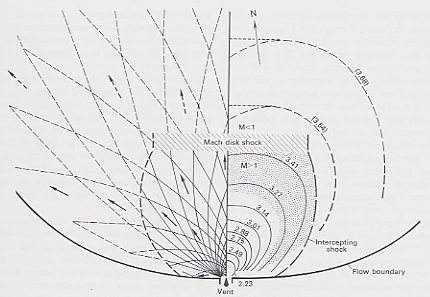
Figure 223. --Map of flow field according to model of blast dynamics.
To ease numerical computation problems, the exit Mach number of the flow
is assumed to have been 1.02 instead of the sonic Mach number, 1.00. All
length dimensions, x and y, are normalized to vent diameter. The model
is symmetric about axis of vent, so it is split into two halves here for
conciseness. On left, the characteristics are shown as thin lines radiating
from corner of vent. Boundary of flow is assumed to have been at constant
pressure, 8.7 X 10⁴ Pa (0.87 bar). The peripheral intercepting
shock formed by reflection of the expansion waves from this boundary is
shown as dashed line. Note how reflection of expansion waves deflects boundary
of flow away from its original expansion angle of 96°. Flow directions
are shown by representative arrows, solid within zone where model is strictly
valid, dashed in zone where model is extrapolated across shock waves. On
right, contours of constant Mach number M and, therefore, constant pressure
(P/P0), temperature (T/T0), and density (p/p0)
are shown. Velocities are given implicitly by the Mach numbers. Each contour
is labeled by the value of the Mach number, M. From the innermost contour
outward, values of M, P/P0, T/T0, and p/p0
are given. In the supersonic region, these values are respectively (2.23,
0.087, 0.91, 0.095); (2.49, 0.047, 0.89, 0.053); (2.75, 0.025, 0.87,
0.029); (2.88, 0.018, 0.86, 0.021); (3.01, 0.013, 0.85, 0.016); (3.14,
0.009, 0.83, 0.011). Extrapolated into the subsonic region, where in
fact, M is less than 1, these values are: (3.27, 0.006, 0.82, 0.007);
(3.41, 0.004, 0.81, 0.006); (3.54, 0.003, 0.80, 0.004); and (3.68, 0.002,
0.785, 0.002). The approximate location of the Mach disk shock is shown;
it separates the inner region of supersonic flow, for which the model is
valid, from the outer subsonic zone in which no solution has been obtained.
Model is extended into this region where the contours are shown as long
dashed lines and Mach numbers are shown in parentheses. Downward curvature
of outer contours near axis of flow is probably an artifact of the grid
size used in the numerical solution, and the likely contour shape is shown
by short dashed lines.
A number of effects not considered in this simplified analysis must
be kept in mind in applying this model to Mount St. Helens. Friction would
have decreased the supersonic flow velocities toward sonic conditions (that
is, toward about 100 m/s); changing topography would have increased and
decreased velocities as the flow progressed. Thus, as the flow initially
expanded and dropped about 1 km in elevation toward the North Fork Toutle
River, the effects of friction and gravity would have opposed each other.
After crossing the North Fork Toutle River, the flow rose again into relatively
high country, and the effects of friction and gravity would both have slowed
the flow. The effects of mass addition to, and loss from, the flow were
assumed here to have been compensatory, as large debris fell out and trees
and soil were entrained; in detail, this assumption cannot be correct because
of the differing sizes, temperatures, and densities of the materials. Because
of these considerations, I believe that the model velocities are high upper
limits on actual flow velocities.
INFERENCES AND APPLICATIONS OF THE
MODEL TO THE BLAST AT MOUNT ST. HELENS
The model can be applied directly to the Mount St. Helens blast with
the choice of a vent width, position, and orientation. Examination of the
photographs taken by eyewitnesses suggests a vent width of about 1 km (the
actual width probably was somewhat less at the onset of the blast and somewhat
greater by the end of it), and a position centered at 8,000 ft (2,500 m)
elevation. The normal to the plane of the vent is assumed to have been
5° east of north. The model, superposed on the map of figure 219, is
shown in figure 224.
BLAST VELOCITIES
The initial velocity of the blast is assumed to have been initially the sonic velocity of the multiphase mixture, about 100 m/s. The velocity increased toward an upper limit of 325 m/s due to lateral expansion. A simple model for the effect of the blast on the near-field atmosphere is given as Appendix 2. Because 325 m/s is probably a high upper limit to flow velocities, due to the effects discussed in the last section, the velocity of the blast apparently did not, on the average, exceed the speed of sound in the surrounding atmosphere (about 330 m/s). Thus, a strong atmospheric shock wave was not generated. However, velocity variations in the flow due to turbulence could have caused velocities in parts of the blast to be very close to or even to exceed the sound speed of air. These parts of the blast would generate significant velocity and pressure perturbations in the atmosphere locally, and, in places, may have generated local atmospheric shocks. The white lenticular clouds on the periphery of the blast and, particularly, in reentrants in the advancing blast front (as pointed out by H. H. Kieffer, oral commun., 1981), may have indicated the formation and dissipation of such local compressions and shocks. The reentrants would be regions of transient high pressure as atmospheric compression waves generated by lobes of the blast intersected head-on or obliquely in the air surrounded by the lobes. It is well known from bomb detonations that temporary condensation clouds can form in the zone of negative pressure that follows the passage of atmospheric shocks (Young, 1965). This phenomenon occurs because subcooling of a saturated atmosphere in the negatively pressurized air causes temporary condensation of the atmospheric moisture. Condensation clouds of this origin were photographed at volcanic eruptions at Ngauruhoe in New Zealand (Nairn, 1976).
As the material of the flow expanded from the vent, it was deflected
through an angle somewhat greater than 90° (96°) around the edges
of the vent due to the high pressure of the reservoir, compared to that
of the surrounding atmosphere. This large initial deflection accounts for
the felled trees in regions behind or south of the vent. As the flow progressed
away from the vent, the south margin veered toward the northwest and northeast
because the initial expansion waves were reflected from the constant pressure
boundary of the flow, that is, the atmosphere pressed in on the flow, keeping
it from overexpanding. The survival of eyewitnesses at whom the flow was
initially directed (for example, in parts of the North Fork and South Fork
Toutle River drainages) is solely due to these internal wave reflections.
PRESSURES, TEMPERATURES, AND DENSITIES
Near the volcano (within about 6 km), the pressure in the flow was above ambient pressure, but beyond this distance, to about 11 km, the pressure dropped below ambient because the overexpansion created a stable low-pressure core within the blast flow. The existence of this low-pressure zone may explain why vehicle windows in some parts of the devastated area exploded (Bea Johnston, University of Washington, oral commun., 1980) rather than imploded.
If there had been no admixture of cold organic or rock debris as the flow advanced outward from the volcano, the temperature of the flow would have remained relatively high, owing to the buffering of the gas temperature by the heat content of the included solids; the temperature would have dropped only 20 percent, from the initial temperature of 600K (327°C) to 480K (207°C) at the singed zone. These calculated temperatures agree remarkably with temperatures deduced by Davis and Graeber (1980) from material degradation within the devastated area.
The density distribution in the flow, shown in figure 224, suggests
the mechanism by which the range of the flow was determined, a mechanism
that explains the observed peculiarities of the transition zones discussed
in the section on "Observations of the blast and its effects to be addressed
by the model." Consider first the likely density of the atmosphere in the
vicinity of the mountain as the quasisteady flow modeled here became established.
This flow regime followed the landslide and the unsteady flow front, and
overrode its own basal shear layer; field evidence and theoretical considerations
suggest that the part of the flow modeled here as steady flow outdistanced
the slide and the unsteady front. In fact, it is conceivable that late
stages of the flow overtook early stages, because deeper material tapped
later was presumably hotter and, therefore, would expand with higher velocities.
In spite of the fact that the atmosphere would have been heated by passage
of the initial pressure wave in it (Appendix 2) and, therefore, would have
had a density decrease of a few percent, dust ladening due to the landslide
and the early stages of unsteady flow would have caused a substantial density
increase. The most energetic part of the blast would either have been following
the blast's dusty precursors or approaching an atmosphere with an enhanced
density: an atmosphere having a density between its normal value (for example,
to the west, the direction from which the prevailing winds came) and a
value increased by a factor of two, three, or even five (for example, to
the east, where the winds might have carried dust, or where previously
erupted blast material had arrived) is plausible. As the flow expanded
into this atmosphere, the density of the flow continually decreased until
the density became less than that of the atmosphere (or flow) in front
of it. The flow therefore simply lifted from the ground and ramped upward
into the atmosphere, thus being "stood up" in the words of eyewitnesses
(Rosenbaum and Waitt, this volume). Because it lifted nearly vertically,
rather than dispersing laterally, the width of the transition zones and
the sharpness of the boundaries depended on the topography. At areas where
the topography dropped away under the rising blast cloud, the transition
zones are narrow and sharply demarked, whereas where the topography rose
subparallel to the rising blast, the zones were wider and less clearly
defined. The close agreement of the contour where the density of the flow
was two times atmospheric density (M = 3.68 contour) with the actual boundary
of the devastated area (fig. 224) suggests that hazard zones for such flows
may ultimately be predictable. Limiting factors for predictive accuracy
will be knowledge of reservoir conditions and of processes at the boundary
of the flow atmosphere.
DIRECT AND CHANNELIZED BLAST ZONES
Reflection of the expansion waves from the flow boundaries into compressive waves that ultimately coalesced into the intercepting shocks probably produced a Mach disk shock about 11 km north of the vent. The flow on the upstream side of this disk would have been supersonic, and the flow on the downstream side, subsonic. It is proposed here that the boundary between the direct blast zone and the channelized blast zone in the region north of the vent marks the position of the Mach disk shock, and that possibly the boundaries on the east and west represent the positions of the much weaker intercepting shocks (fig. 224). This inference is based not only on the coincidence of the model shock boundaries and the map boundary between the direct and channelized blast zones, but also on the fact that supersonic flows are not deflected by the topography in the same way as subsonic flows and, therefore, should leave different patterns of downed trees in relation to topographic features, patterns that are consistent with the proposed boundaries.
Compare first the lateral deflection of supersonic and subsonic streamlines by topographic features, such as valleys. As shown in figure 225A, subsonic flow is diverted smoothly around obstacles because signals of the obstacle's presence are propagated upstream into the flow. However, supersonic flow is diverted around obstacles through shock waves that are oriented downstream from the flow, because signals of the obstacle cannot propagate upstream. Because of the time and distance needed for temporal or spatial disturbances to propagate into supersonic flow, it tends to be less affected by complex terrain than subsonic flow. Thus, the generally radial nature of the streamlines, in spite of large topographic features within the direct blast zone, is consistent with supersonic flow, and the more topographically controlled shape of the streamlines within the channelized blast zone is consistent with subsonic flow.
Although in map view a supersonic flow may be relatively unaffected
by the topography, a vertical cross section shows more influence of topography
because the basal boundary-layer is strongly affected. Supersonic and subsonic
boundary layer flow is shown schematically in figure 225B. The felled-tree
reversals that occur at places like Fawn Lake (fig. 220B), although not
qualitatively inconsistent with subsonic flow, are compatible with supersonic
boundary-layer behavior. As such tree-reversal patterns are predominant
in the direct blast zone and are less common in the channelized blast zone,
the patterns are consistent with the concept of transition from supersonic
to subsonic flow across the Mach disk shock at the boundary between the
two zones.
ACOUSTIC PROPERTIES OF THE BLAST
Within the expanding blast flow, a forest was being uprooted and destroyed, soils were being ripped from the ground, and boulders, trees, and glacial ice blocks were being mixed and transported kilometers from their source; yet, the blast approached eyewitnesses with amazing silence. There were two causes of this silence: first, supersonic focusing of sounds in a downstream direction, and second, strong attenuation of sound by the multiphase particulate cloud. Consider the propagation of sound within supersonic and subsonic flow, as illustrated in figure 225C. In subsonic flow, sound pulses generated within the flow (for example, at O) travel downstream faster than the flow itself advances and, therefore, will eventually reach all external points, such as X, Y or Z. However, in supersonic flow, sound pulses propagate downstream only within a cone, called the Mach cone, whose angle is given by ------ M is the Mach number of the flow, the ratio of the flow velocity to the local sound speed. Von Karman (1947) called the region inside the Mach cone the "zone of action" and the region outside of it, the "zone of silence." Assuming Mach numbers of 2 to 3 (fig. 224), the above equation shows that sound should have been strongly focused within ±20° to ±30° of the local direction of streamlines. Thus, observers not on or close to streamlines would have been in the zone of silence.
Even observers in line with the flow, or embedded in it, would have heard little because of the strong attenuation of the dense particulate cloud. For reference, in clear air, sound is attenuated by viscous dissipation and irreversible heat flow as the pressure oscillations of the sound waves propagate. The attenuation (fraction of energy lost per unit distance traversed) is (Morse and Ingard, 1968): ------ where 77 is the coefficient of bulk viscosity, , is the coefficient of viscosity, k is the wave number, p is the density, c is the sound speed, K is the thermal conductivity, Cp is the specific heat at constant pressure, and 7 is the isentropic exponent of air, and a is the attenuation coefficient. At a typical acoustic frequency of 1,000 cps (cycles per second), the attenuation coefficient a for clear air is approximately 3 x 10⁻⁷/cm (Morse and Ingard, 1968). Therefore, sound is attenuated to 1/e of its strength (where e is the base of natural logarithms, 2.72) in a distance of roughly 10 km. If the air is filled with a cloud of small particles, acoustic energy is both scattered and absorbed by the particles. Although both processes contribute to the attenuation (as well as others not considered here), absorption was the more important factor in the blast at Mount St. Helens.
The attenuation coefficient for absorption by the cloud is (Morse and Ingard, 1968) ------ where N is the number of scattering particles per unit volume, and a is the absorption cross section per scatterer, given by ------ where a is the particle radius, 7 is the isentropic exponent of the gas phase, k is the wave number, 7 ' is a density ratio [yp' = (3pe - 3p)/(2pe + p), where pe is the density of the entrained particles, and p is the air density], and dh and dv are, respectively, thermal and viscous boundary layer thicknesses: ------ where , K, and Cp were defined above, and is the angular frequency of the acoustic wave.
![]() Consider
the attenuation in the distal edges of the blast where some eyewitnesses
survived. Assume, from figure 224, that the density of the blast in these
regions was about 10 times atmospheric density. Assume, also, that the
particles were 0.01 cm radius. These assumptions require about 1,000 particles/cm3.
Then, using typical values of the parameters, 7 = 1.4, k = 0.19/cm, Yp'
= 3/2, the absorption cross section per scattering particle was ------
Additional attenuation would have arisen from particulate scattering, and
from absorption and scattering by turbulent cells within the flow. Thus,
sound intensity would have decreased to 1/e of its intensity in less than
10 m, an attenuation more than 10,000 times that of clear air.
Consider
the attenuation in the distal edges of the blast where some eyewitnesses
survived. Assume, from figure 224, that the density of the blast in these
regions was about 10 times atmospheric density. Assume, also, that the
particles were 0.01 cm radius. These assumptions require about 1,000 particles/cm3.
Then, using typical values of the parameters, 7 = 1.4, k = 0.19/cm, Yp'
= 3/2, the absorption cross section per scattering particle was ------
Additional attenuation would have arisen from particulate scattering, and
from absorption and scattering by turbulent cells within the flow. Thus,
sound intensity would have decreased to 1/e of its intensity in less than
10 m, an attenuation more than 10,000 times that of clear air.
DURATION, FLUX, AND ENERGY OF THE BLAST
Duration of the blast cannot be inferred from steady-state flow considerations, and, although the above steady-flow model may well explain spatial observations, it cannot be used to infer temporal relations. The blast duration may have been quite different at different places within the devastated area. Unsteady flow considerations suggest a duration of 10-20 s at the vent.
The mass flux per unit area during steady flow implied by the model is 0.6 X 10⁴ g/s/cm2 or, for a vent area of 0.25 x 1010 cm2, the mass flux was 0.15 X 10¹⁴ g/s. These values may be maximum fluxes. The thermal-energy flux per unit area was 2.5 MW/cm2, or the thermal flux was 0.63 X 10¹⁰ MW for the assumed vent area. The total mass in the blast (0.25 X 10¹⁵ g) would have been discharged through the vent in 17 s of steady flow. The brevity of this time implies that much of the flow was unsteady and that accurate models of the blast based on unsteady flow must be developed.
From the measured mass ejected and the assumed initial temperature of
600K, the total thermal energy released upon cooling to ambient temperature
(273K) was 1024 ergs or 24 Mt, of which 7 Mt was released during
the propagation of the blast through the devastated area, and 17 Mt during
penecontempo-raneous condensation of the steam and cooling of the condensed
water and entrained solids.
APPENDIX 1: PRECURSOR, VAPORIZATION,
AND MULTIPHASE EXPANSION WAVES
The discussion of the initiation of the eruption has ignored a number of details that are important in explaining observed phenomena at the beginning of the blast. For example, the discharge did not begin immediately at the appearance of the landslide scarp. Nearly 20 s elapsed between the time of the first appearance of an exposed scarp and the first appearance of the puffs of dust and steam that heralded the blast (Moore and Albee, this volume; Malone and others, 1981; Voight, this volume). This delay could have indicated that the material immediately adjacent to the exposed scarp did not contain volatile components and that tapping of a deeper reservoir may have been necessary (with the delay due to the migration of the volatiles through the overlying drier material). However, even if the reservoir were immediately adjacent to the exposed scarp, a delay in discharge is to be expected, due to the time required for a series of finite-amplitude expansion waves to establish the blast flow. The complex expansion process that actually occurred can be simplified conceptually by dividing it into three separate processes that are initially necessary for establishment of the flow. First, a precursor rarefaction wave must reduce the pressure of the system locally to the pressure of the saturation curve; second, a vaporization wave must accomplish the transformation from liquid water to steam (or nucleation and growth of a vapor phase from other dissolved gases or a magma if the gases are abundant); and third, a multiphase expansion wave must accelerate the vapor and particles together out of the vent. This multiphase expansion wave would actually spread further into two components, a frozen expansion wave of the vapor phase alone (the solid particles temporarily immobile because of iner-tial effects), and an equilibrium wave in which the particles move with the expanding gases. The effects of these two waves were visible in the March and April phreatic eruptions, in which the eruption was frequently heralded by puffs of clear white steam (accelerated by the frozen expansion), followed by the development of the ash-laden plume (accelerated by the equilibrium wave).
Few data are available on the speed of such finite amplitude rarefaction waves in such complex mixtures. The precursor rarefaction wave is assumed to have moved into a water-saturated hydrothermal system or into an undersaturated magma, and, therefore, is assumed to have had a speed of about 1 km/s. The velocity of a finite amplitude vaporization wave, even in pure H2O at 12.5 MPa, is not known, but it is reasonable to assume that it is about 50 m/s, about half of the equilibrium sound speed of small-amplitude sound waves at that pressure (Kieffer, 1977; Barclay and others, 1969). The velocity of the equilibrium multiphase expansion wave was calculated in the text (equation 5), and was shown to have been about 100 m/s.
The flow would not become established until this series of transient
waves had passed into the reservoir and been reflected back at least once
(Shapiro, 1953-54). The development of the discharge would be controlled
by the slowest process, that of the nucleation and formation of the vapor
phase. For expected vaporization-wave velocities of 50 m/s and reservoir
depth of about 500 m, a time on the order of 10 s from the exposure of
the scarp to the development of the flow is not unreasonable, just due
to the transient dynamic processes necessary to establish the flow.
APPENDIX 2: SIMPLIFIED MODEL FOR THE EFFECT
OF THE BLAST ON THE NEAR-HELD ATMOSPHERE
Available estimates of pressure, temperature, and wind velocity in the
atmosphere in front of the approaching blast provide constraints on the
blast dynamics. A more detailed model than the one presented here, particularly
of the near-field to far-field acoustic propagation, has been reported
by Reed (1980).
Consider the initial phase of the Mount St. Helens eruption to have had two stages: (1) the slip and subsequent motion of the landslide toward the North Fork Toutle River drainage; and (2) at a later time, t0, (about 20 seconds), the eruption of the blast, having an initial velocity, v0, of about 100 m/s, (equation 6) and expansion to about 300 m/s (fig. 224). In order to calculate the effect of the motion of the landslide and the blast on the atmosphere, consider both the slide and the blast to be rigid bodies (an approximation justified in the early stages of the eruption by the fact that the impedances (pc) of the slide [(pc)slide ~ 105] and of the blast [(pc)blast ~ 104] are much greater than of those of air [(pc)air ~ 3 X 10³)]). Assume that the motion of the landslide can be described by ------ where s is the distance traveled, g is the gravitational acceleration, 0 is the average angle of the slope across which it moved, = 0.12 is the coefficient of friction, and t is the time after the initiation of motion. The velocity of the slide is given by ------ and is assumed to have been a maximum when the slide arrived at the North Fork Toutle River drainage, 4.95 km from its point of origin. From equation Al, the time of arrival of the slide at the North Fork Toutle River would have been 114 s after inception of motion, and from equation A2, the velocity at this time would have been 87 m/s. Compression waves were propagated from the landslide into the atmosphere from the instant of its first motion; ultimately, they would have coalesced to give an atmospheric shock. It can be calculated (Thompson 1972, p. 401) that in a uniform atmosphere, the shock would have formed at a distance s* given by ------
For 0 taken as 11° (the average slope across which the slide traveled from 6,400 ft to 3,200 ft elevation), the shock would have formed 123 km from the origin, and 367 s after the beginning of the slide.
![]() By analogy
to the pressure built up in front of an airplane wing, the pressure P0
in front of the moving wedge of debris was ------ where y is the adiabatic
exponent of air, and cair is the speed of sound in air, 335
m/s. The far-field atmospheric pressure, P, is taken as 8.7 x 10⁴
Pa (0.87 bar). Thus, the pressure was 0.910 X 10⁵ Pa (0.91 bar)
at the North Fork Toutle River drainage, corresponding to an overpressure
of 4.0 X 10³ Pa (0.040 bar). As a first approximation, assume
that the pressure decay was proportional to 1/r3 (that is, due
to spherical divergence alone), and assume that the overpressure was produced
inside of the radius r0 = 5 km from the summit. Then,
at the nearest barograph at Toledo, Wash., 54 km from the summit, or about
50 km from the source of the overpressure, the overpressure would have
been about 3 Pa (3.0 X 10⁻⁵ bar), and at Seattle, 150 km from
the mountain, the overpressure would have been only about 0.1 Pa (0.1 x
10-5 bar). The overpressure due to the landslide would barely
be detectable on the Toledo barograph and would not have been audible in
Seattle (15 Pa (1.5 X 10⁻⁴ bar) is considered the minimum overpressure
for audible detection). A higher coefficient of friction and(or) stronger
attenuation, both likely, would have rendered the atmospheric perturbation
due to the landslide undetectable, and I conclude that the landslide was
not the cause of the Toledo (or any other far-field) barograph deflection
or audible noise.
By analogy
to the pressure built up in front of an airplane wing, the pressure P0
in front of the moving wedge of debris was ------ where y is the adiabatic
exponent of air, and cair is the speed of sound in air, 335
m/s. The far-field atmospheric pressure, P, is taken as 8.7 x 10⁴
Pa (0.87 bar). Thus, the pressure was 0.910 X 10⁵ Pa (0.91 bar)
at the North Fork Toutle River drainage, corresponding to an overpressure
of 4.0 X 10³ Pa (0.040 bar). As a first approximation, assume
that the pressure decay was proportional to 1/r3 (that is, due
to spherical divergence alone), and assume that the overpressure was produced
inside of the radius r0 = 5 km from the summit. Then,
at the nearest barograph at Toledo, Wash., 54 km from the summit, or about
50 km from the source of the overpressure, the overpressure would have
been about 3 Pa (3.0 X 10⁻⁵ bar), and at Seattle, 150 km from
the mountain, the overpressure would have been only about 0.1 Pa (0.1 x
10-5 bar). The overpressure due to the landslide would barely
be detectable on the Toledo barograph and would not have been audible in
Seattle (15 Pa (1.5 X 10⁻⁴ bar) is considered the minimum overpressure
for audible detection). A higher coefficient of friction and(or) stronger
attenuation, both likely, would have rendered the atmospheric perturbation
due to the landslide undetectable, and I conclude that the landslide was
not the cause of the Toledo (or any other far-field) barograph deflection
or audible noise.
The blast started about 20 s later than the landslide (Moore and Albee, this volume; Malone and others, 1981; Voight, this volume) and had an initial vent velocity of about 100 m/s and a calculated maximum areal expansion of 325 m/s. I assume that the shock audible at distances greater than 54 km (Toledo) was produced as the highest velocities were obtained (that is, that shocks produced at lower velocities were inaudible, were overtaken by the stronger shock, or both). I further assume that the acceleration to the highest velocities was produced over the same distances as given by the steady-state solution (figs. 223 and 224). The acceleration is then given by ------ then, equations A3 and A4 can be applied to give the distance and time of shock formation, with the coefficient A = 1/2al. From the steady-state solution, the acceleration from M* = 2.79 to M* = 3.09 (from 290 m/s to 321 m/s) occurred over 6,080 m, giving an acceleration of 155 cm/s2 and a coefficient A = 78 cm/s2. The shock would then form 60 km from the region of acceleration, which was 12 km from the old summit; that is, the shock would have formed about 72 km from the old summit. This distance for shock formation satisfies observational constraints that the shock formed somewhere between Toledo (54 km) and Seattle (150 km). From equation A6, the pressure in front of the blast as it reached 325 m/s would have been 1.6 X 10⁵ Pa (1.6 bars), corresponding to a peak-to-peak barograph deflection of 1.54 X 10³ Pa (0.015 bar), about twice that inferred from Reed's (1980) data, at Toledo, 54 km from the old summit. These values should be considered in satisfactory agreement in view of (1) the use of a one-dimensional equation to calculate the distance of shock formation; (2) the assumption of a homogeneous atmosphere; (3) the assumption of a 1/r3 divergence; and (4) the fact that 325 m/s is an upper limit on actual velocities. A more detailed treatment treating actual propagation paths for the compressive waves has been given by Reed (1980).
Temperature changes induced in the atmosphere by the blast front would have been quite mild. Within the first few kilometers, where the blast cloud was sufficiently more dense than the atmosphere to have acted as a rigid wedge, temperature changes were approximately given by ------ where T is the temperature, V is the wedge velocity, and Cp is the specific heat of air, about 107 ergs/g/K. For velocities of about 200 m/s close to the mountain, the temperature change would have been about 20° C, perhaps sufficient to cause index of refraction changes and, thus, the observable atmospheric disturbance ahead of the blast reported by some eyewitnesses (Rosenbaum and Waitt, this volume). As the density of the blast decreased, it was less capable of causing high pressure, temperature, and velocity perturbations in the atmosphere and, therefore, even though increasing in speed itself, did not generate significant atmospheric temperature effects.
These calculations, although based on greatly simplified assumptions,
show that the model conditions for the blast dynamics are at least consistent
with the observational data available.
| START & IMAGES |
|