|
|
|
|
|
|
|
|
|
|
|
|
|
 |
Volcanic Events, pg. 2 Mount St. Helens History, pg. 3-15 Eyewitnesses, pg. 53-67 Absolute Times, pg. 81-82, 86 Activity Sequence, pg. 127-134 Gas Studies, pg. 190-191 |
Chemical
Compositions, pg.
233-250
Ash Clouds, pg. 323-333 Blast Dynamics, pg. 379-400 Rapid Deposition, pg. 466-478 Phreatic Explosions, pg. 509-511 New Lava Dome, pg. 540-544 Ash-Fall Deposits, pg. 568-584 Water Chemistries, pg. 659-664 River Water Quality, pg. 719-731 |
ABSOLUTE TIMES
The magnitude-5+ earthquake at 0832:11.4 PDT presumably started minor rock and ice falls from the south crater wall, as observed and described by Stoffel and Stoffel (1980). Following an interval of a few seconds, a major fracture propagated rapidly along the apex of the bulge north of the summit crater. North of this fracture, the rock mass "rippled and churned," apparently in place, for an interval of several additional seconds. The north face then slid down in a gigantic rockslide, as indicated (below) by the Stoffel and Rosenquist photograph sequences (Voight and others, this volume, fig. 201; fig. 38). Each of the two time intervals mentioned above has been estimated at 5-10 s by Dorothy and Keith Stoffel (oral commun., November 1980). Noting the slowness with which slide movements begin from a static condition, the onset of rock sliding is arbitrarily taken as 0832:21 PDT. An error of several seconds could easily be associated with the estimated delay time, and an adjustment of this estimate may eventually be necessary.
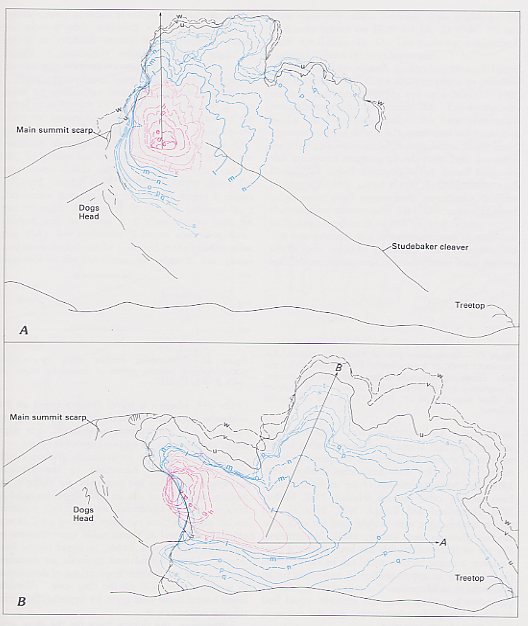
Figure 43.--Sketches of Mount St. Helens based on Rosenquist photographs showing growth of eruption clouds. Letters identify sequential frames. Growth rates vary spatially and with time, but relative spacing roughly indicates relative time intervals between frames (compare with fig. 40). Measurement lines for A and B indicate eruption cloud data used in figures 46 and 45. A, vertical eruption plume from summit grows while plume source sinks due to rockslide movement (slide II). B, bulbous explosion clouds grow along scarp exposed by rockslide movement (slide I). Blast cloud moves out over Sugar Bowl and toward observer, in direction of seismic station SOS.
|
|
Next, the time interval between the rockslide initiation and
Rosenquist frame c was estimated from a dynamic model for rockslide
motion. If friction is constant, acceleration (a*) of the slide
mass can be calculated as a function of displacement (x) from
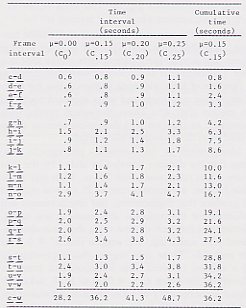
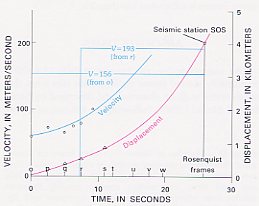
Measurement on the Rosenquist photographs indicates that the distance traveled by slide I by the time frame c was taken was about 700 m. With zero rockslide friction, a minimum time of 21.4 s was required to produce this displacement. But displacements and velocities for the rockslide after frame c was taken, plotted as a function of time using the ice-avalanche-based time scales (fig. 47), suggest that * = 0.1 for the rockslide. These data suggest that approximately 26 s elapsed between slide initiation and frame c. Therefore, for frame c, tc = 0832:47 PDT, acknowledging an uncertainty of a few seconds. Estimated absolute times for each frame can now be determined by adding the cumulative times to tc (table 6; left side). |
| Figure 44.--Displacement and velocity plotted versus time, for time interval between frame o and destruction of seismic station SOS. Triangle, displacement data point based on direct measurement; circle, velocity data point based on displacement measurement and time calculated from Rosenquist photographs. C.15 time scale. |
 |
(Above - excerpted from Pg. 81-21 -- Below - excerpted from Pg. 86)
CONCLUSIONS
Methods discussed in this report permit the calculation of estimated times of events that fit dynamic models for the ice avalanches and slide I, and are consistent with both eyewitness observation and seismic events. A first-approximation timetable is as follows, starting with the reference earthquake at 0832:11.4 PDT.
1. For the interval between the earthquake and the rockslide, a range of values is estimated as 7-20 s, based on calculations and eyewitness reports. A reasonable estimate of 10 s after the earthquake gives 0832:21 PDT as the time of onset of slide I motion.
2. By the time of frame c (tc), slide I had traveled about 700 m. A dynamic model of slide I indicates that no less than 21 s was required for this displacement. A value of 26 s is suggested by comparison of velocity and displacement data to theoretical curves, resulting in a time of about 0832:47 PDT for tc.
3. Velocity data for slide I suggest that use of the C.20 scale is preferable to the C.15 scale until about frame l, inasmuch as the C.15 scale predicts increases in velocity in excess of the frictionless rockslide idealization. On the other hand, the C.20 cumulative time (41 s) for the entire photographic sequence is large with respect to the interval of time bounded by destruction of seismic station SOS. A cumulative time of 40 s for the photographic sequence is probably too high, whereas a time of 32 s, which was obtained using the C.20 scale for frames c to l and the C0 (frictionless) scale for frames m to w, is likely too low. The C.15 scale provides a reasonable cumulative time estimate of 36 s. This value is probably accurate to within 4 s, or within 13 percent of the actual value.
4. The average time interval between frames is thus 1.8 ± 0.2 s. Individual intervals between frames for the C.15 scale vary from 0.8 to 3.7 s. These intervals are at present considered slightly low for frames c to l and too high for the remaining frames.
Other eyewitness photographs can be fixed in time by correlation with the time scale based on the Rosenquist photographs. One method of correlating is by matching various slide or eruption-cloud positions, such as the height of the summit plume above the crater. Data that can be used for this purpose are shown in figures 46, 45, and 43.
Although further adjustments are anticipated, this time scale is considered
to be sufficiently accurate to permit dynamic analyses of various eruption
phenomena (see figs. 47, 44). For example, the data suggest velocities
of 50-70 m/s for slide I, 50-100 m/s for the blast cloud at Sugar Bowl,
and 90 m/s (peak velocity) for the summit plume.
| START & IMAGES |
|