|
|
|
|
|
|
|
|
|
|
|
|
|
 |
Volcanic Events, pg. 2 Mount St. Helens History, pg. 3-15 Eyewitnesses, pg. 53-67 Absolute Times, pg. 81-82, 86 Activity Sequence, pg. 127-134 Gas Studies, pg. 190-191 |
Chemical
Compositions, pg.
233-250
Ash Clouds, pg. 323-333 Blast Dynamics, pg. 379-400 Rapid Deposition, pg. 466-478 Phreatic Explosions, pg. 509-511 New Lava Dome, pg. 540-544 Ash-Fall Deposits, pg. 568-584 Water Chemistries, pg. 659-664 River Water Quality, pg. 719-731 |
ACTIVITY PRIOR TO MAY 18
A swarm of relatively shallow earthquakes began March 20, 1980, beneath the north flank of the mountain, 1-2 km north of the summit. The first in a series of phreatic eruptions began in the early afternoon of March 27 and excavated a small summit crater in the center of a new 1.5-km-long graben alined east-west (Williams, 1980, p. 72). A second crater formed to the west by March 29, and by April 7 the two craters had merged to produce an elongate crater. After April 7, the volume of the crater increased slowly to a maximum of about 9 X 10⁶ m3 by May 12 (fig. 71). The phreatic explosions that began on March 27 were probably initiated by pressure release due to thinning and fracturing of cover rocks and ice within the graben.
Small lakes and ponds were in the phreatic crater prior to May 18 and are visible in all of the aerial photographs of mapping quality. Commonly the lakes were frozen and contained floating blocks of ice but were recognizable by their horizontal surfaces. These lakes were fed by melt-water streams flowing down the crater walls from the base of melting glaciers, as well as from ice talus melted by steam vents on the crater floor. Lake water was blown out during phreatic explosions but quickly accumulated again between eruptions.
The map of April 7, when compared with that of August 1979, showed that dramatic changes had occurred (fig. 70A). A prominent bulge about 1.8 km in diameter had developed immediately north of the graben. The long axis of the bulge crest was oriented northeast-southwest, oblique to that of the elongate crater and the graben. The apparent vertical displacement of both graben downward and bulge upward grew until the climactic eruption of May 18. The volume increase of the graben was about one-quarter that of the bulge (fig. 71) so that the net volume of the volcano increased. By April 7 the net increase in volume relative to August 1979 was 52 X 106 m3, and by May 18, an estimated 114 X 106 m3; the average rate of volume increase from April 12 to May 12 was 1.3x10⁶ m3/day. Contours of apparent elevation changes between maps (fig. 70) indicate that the north-south width of the graben grew from 360 m (from August 1979-April 7, 1980) to 600 m (May 1-12, 1980). The zero contour (boundary between downdrop of graben and uplift of bulge) migrated north at an average rate during this period of 8.6 m/day.
The initial area of greatest uplift of the bulge occurred in the south-central part adjacent to the northern boundary of the graben (figs. 70A and B). Projection of growth-rate curves backward in time suggests that the bulge may have begun growing no earlier than the beginning of seismic activity on March 20 (fig. 71); however, its early growth may have been more rapid than measured later, and it may have begun slightly before March 27, 1980, when growth was first apparent. The region of greatest uplift enlarged as the bulge developed, and the primary uplift moved north in concert with the expanding graben. In addition, a secondary mound developed 1 km to the northeast in the upper part of the combined Forsyth and Leschi Glaciers (figs. 70B-D). This secondary mound is believed to have been caused by very accelerated movement of ice due to oversteepening of the mountain, because on May 12 the lower part of it failed, producing the largest pre-May 18 avalanche, composed largely of ice (fig. 72D), and on May 18 large ice avalanches came from this region (figs. 74B and 75B). Further evidence that the northeastern mound was only superficial and not caused by a localized intrusion is the fact that it overlapped and lay partly northeast of the rim of the amphitheater produced by the landslide and explosions of May 18 (fig. 69).
The evolving pattern of faults and fractures was well established by April 7 (fig. 72A), with the largest fault marking the south side of the graben. This fault retained its position though other nearly parallel faults, also downthrown on the north, developed south of it (fig. 72B). However, north of the explosion crater, east-west fractures formed a widening band as the boundary of the graben migrated northward (fig. 72C and D). Also a zone of faults and fractures in ice and snow enlarged to the northeast as the combined Leschi and Forsyth Glaciers responded to bulge oversteepening before avalanching on May 12 (fig. 72D).
The increase in elevation of points within the bulge above the preexisting surface is the net effect of both absolute uplift and northerly horizontal movement. The rate of horizontal motion within the bulge was rather constant at 1.5-2.0 m/day as determined by geodetic measurements (Lipman, Moore, and Swanson, this volume). This rate is verified by the mapped displacement of Goat Rocks (the only readily recognizable mapped point), which moved 64 m in a N. 32° W. direction from April 7 to May 12, a rate of 1.8 m/day. Assuming a horizontal rate of 2 m/day and a slope of 30°, the amount of apparent vertical uplift should average about 2 tan 30° = 1.2 m/day. Assuming uplift began March 20, 1980, the rate of apparent vertical uplift of the bulge at the point of greatest displacement at successive intervals was 5.6 m/day (fig. 70A), 4.3 m/day (fig. 70B), 2.6 m/day (fig. 70C), and 2.7 m/day (fig. 70D). Hence the high point of the bulge was generally rising above the mountain slope more than twice as fast as would have been expected from strictly horizontal motion. Roughly the upper half of the bulge was that part which underwent some absolute vertical uplift. No geodetic targets could be maintained in this part of the bulge because of its unstable character.
The behavior of the bulge and graben suggests that uplift of the south
edge of the bulge resulted from growth and expansion of a shallow intrusion
of magma (cryptodome) beneath the summit and north flank. The volume of
the cryptodome attained 0.11 km3 by May 18, equivalent to a
sphere with a diameter of about 600 m. The top of the cryptodome apparently
migrated north as it reached higher levels causing early uplift of a peak
north of the graben. This area later subsided as a second peak further
north became elevated (fig. 73). As the dome rose, it stretched and shouldered
aside the area north of the summit, producing the graben, and it oversteepened
the north flank, causing it to move north under the influence of gravity
at a rate of 1.5-2 m/day (Lipman, Moore, and Swanson, this volume). The
inferred presence of a shallow dacitic cryptodome was later supported by
the fact that fragments of fresh, originally hot dacite derived from it
comprise a large proportion of the directed-blast deposits (Hoblitt and
others; Moore and Sisson; Waitt, this volume). The cryptodome was apparently
intruded beneath the large (1.2 km diameter), 16th-17th century dacite
summit dome (fig. 68), which was funnel shaped and probably filled an earlier
summit crater (C. A. Hopson, written commun., 1980). After stretching and
splitting the summit dome, producing the graben, the cryptodome expanded
northward beneath the summit dome, uplifting its north edge and producing
the bulge.
EVENTS OF MAY 18
A significant photographic record was obtained by several observers from the ground and from the air during the early failure of the landslide. The photographs taken by Keith and Dorothy Stoffel from the air (Williams, 1980), by Gary Rosenquist from near Bear Meadow, 17 km northeast of the summit (Williams, 1980), and by Paul and Carol Hickson (written commun., 1980) from 15 km east of the summit are outstanding.
| An analysis of the Rosenquist and Hickson photographs is aided by comparison
with computer-generated perspective models (Dynamic Graphics, Inc., 1978)
of preemption and posteruption digitized maps as viewed from the camera
stations (figs. 74A and C and 75A and C). This new technique
permits reliable estimation of the elevation and position of features visible
in the photographs.
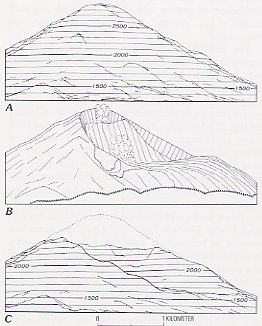
Figure 74 (RIGHT). --Perspective views on various dates of Mount St. Helens from Bear Meadow, 17 km to the northeast. A, Computer-generated model showing topography, August 15, 1979. Contours in meters. B, Sketch from photograph by Gary Rosenquist at about 0832:35, May 18, 1980. Ice and snow avalanches shown by light-dotted pattern. C, Computer-generated model showing topography, July 1, 1980. Preemption profile shown by dotted line. |
 |
The Stoffels, flying over the crater area in a light plane, witnessed several small ice-falls within the crater apparently triggered by the magnitude -5 + earthquake at 0832:11 PDT. About 15 s later they observed the north side of the summit crater begin moving north as a massive landslide. This landslide developed as two giant blocks (fig. 76; and Voight, this volume), here referred to as the bulge block (northern) and the graben block (southern), because they correspond to the regions of uplift and downdrop as defined in figure 70D. The headwall scarp of the bulge block developed slightly north of the north peak, and that of the graben block was about coincident with the main fault south of the crater (fig. 76).
The bulge block began dropping 8-10 s before the graben block, so that by the time the first Rosenquist photograph was taken 15-20 s after landsliding began (fig. 11-9B), the graben block had descended about 200 m and the bulge block, 650 m. (This timing of the Rosenquist photographs, slightly different from that of Voight (this volume), is based on an analysis by S. D. Malone, written commun., 1980.) At this time the headwall scarp between the blocks was 600 m high inclined 65°-70° to the north. The initial explosions began at this time near the base of the high headwall scarp of the bulge block at an elevation of about 2,200 m. By about 0832:43 PDT (fig. 76C) the graben block had descended a total of about 550 m, and the bulge block, 1,100 m, so that the headwall scarp between them was about 700 m high and its base was at an elevation of about 1,750 m. During this time vertical explosions began ripping out of the area of the old phreatic crater in the center of the graben block while those from the high headwall between the blocks intensified, involving the entire scarp. Subsequently these two explosion loci at the top and exposed north side of the graben block merged into a gigantic explosion buttressed on the south (fig. 76C). This eruption fed the north-directed blast that devastated the area to the north and deposited about 0.19 km3 of ash and blocks, about half of which was hot, relatively dense dacite apparently derived from the cryptodome (Moore and Sisson, this volume).
Comparison of the pattern of surface deformation (figs. 70, 73) and the location of the 700-m-high landslide scarp between the graben block and the bulge block suggests that this scarp followed closely the north side of the cryptodome and possibly intersected a part of it (fig. 76). Removal of the bulge block by landsliding effectively exposed and depressurized the cryptodome and its surrounding hydrothermal system of superheated water. The water flashed to steam, and the dacite exsolved magmatic gases, producing the giant explosion.
The sequence of events that followed the downward movement of the graben
block was obscured by eruption clouds that enveloped the mountain. Eventually,
more of the central part of the mountain south of the graben block failed
along successively more southern faults (or by piecemeal crumbling), and
the fragments joined the landslide until much of the amphitheater crater
was formed, and the main volcanic conduit was exposed more than 1 km deeper
than prior to landsliding. The 25-km-high vertical eruption column which
then developed was produced by magmatic explosions generated by reduction
of confining pressure on the volcanic conduit as a result of the removal
of this extraordinary amount of cover rock (fig. 76D).
AFTER MAY 18
The map generated from July 1 aerial photography (fig. 77) indicates that, with the new amphitheater-shaped crater, the height of the mountain was reduced from 2,950 m (9,677 ft) to 2,549 m (8,364 ft). Comparison of contours between the maps of August 15, 1979, and July 1, 1980, indicates that the volume of rock and ice of the volcano above the 4,800-ft contour was 2.62 km3 less than in 1979. However, because the mountain had increased in volume 0.11 km3 from 1979 to May 18, 1980, a total of 2.73 km3 was removed on May 18, most of which was deposited in the landslide-debris avalanche.
The new amphitheater-shaped crater is nearly precisely the width of the mapped bulge but extends 0.5 km north of the previous northern bulge limit. The crater is 2 km wide and 3.9 km long and extends in a northerly direction. The northern limit of the crater is well defined, because the 4,400- and 4,800-ft contours are virtually unmodified (figs. 68 and 77). Despite the fact that about 2.5 km3 of landslide rubble passed over this region, little erosion or deposition took place. This fact places a northern limit on the slip surface bounding the base of the landslide mass. The position of the base of the slip surface (fig. 76) can be estimated from its northern extent, from the height and angle of the headwall scarps as determined from the Rosenquist photographs (fig. 74B), and from the nature of movement of the graben block as seen in the Hicksons' photographs (fig. 75B). (Compare figs. 6 and 9.) The loft imparted on the landslide mass as it left the amphitheater may have been what prevented significant erosion or deposition until deposition began 2 km to the north.
Subsequent to May 18, moderate explosive eruptions and small ash flows
occurred on May 25, June 12, July 22, August 7, and October 16-18. The
June, August, and October events produced small dacitic domes all with
volumes of less than a few million cubic meters (Moore and others, this
volume). The location of the primary vent as defined by the location of
the post-May 18 domes (figs. 73 and 77) lies directly below the center
of the pre-May 18 phreatic crater.
| START & IMAGES |
|